Earth observation guideApplications
Urban areas and infrastructure
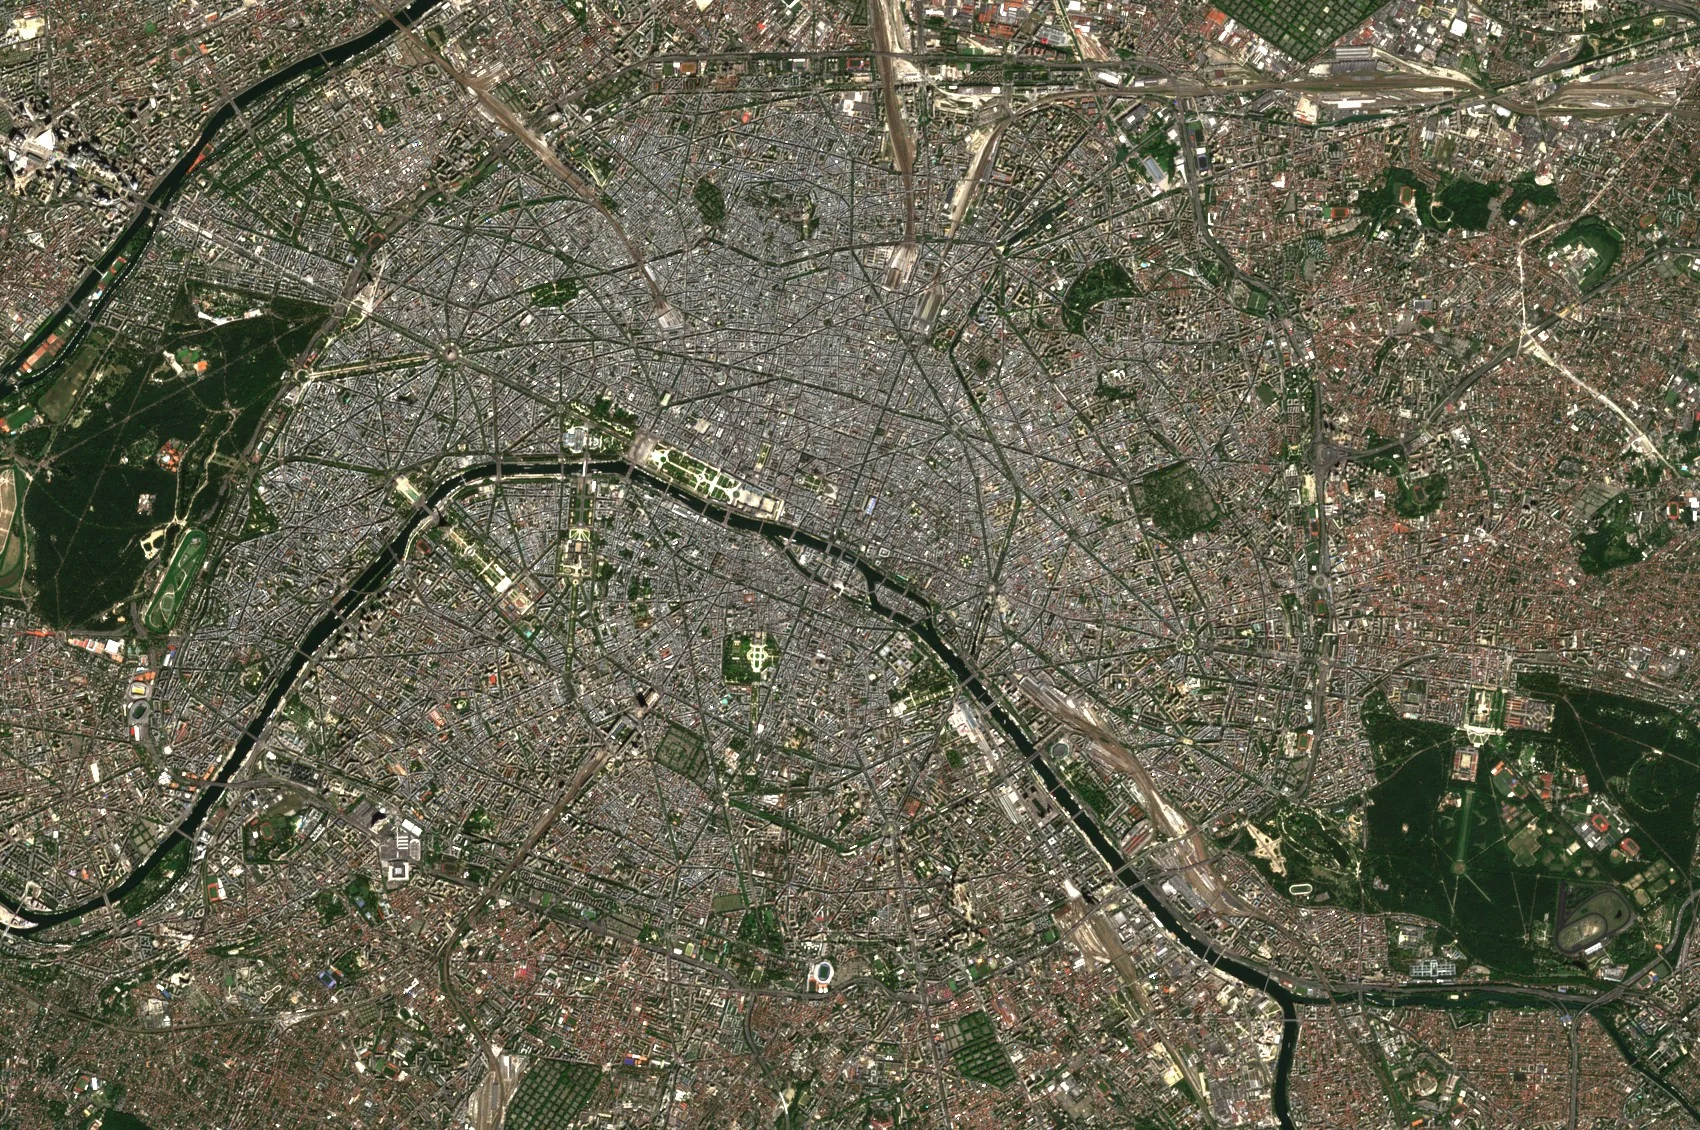
Cities grow outwards and upwards, and the ground, bridges and railways beneath them move by millimetres. Satellites map the growth and measure the movement.
The basics
Maps of towns go out of date as soon as they are printed. Satellites show where new houses, roads and factories have appeared, which helps planners keep up and helps everyone from utilities to insurers know what is where. A more surprising use is measuring movement. By comparing many radar images taken over months, it is possible to see the ground under a city sink by a few millimetres a year, or a bridge start to sag, long before cracks appear. Engineers use these measurements to decide which structures to inspect first.
Why it matters
Most people live in towns, and the buildings, bridges and pipes they depend on are ageing. Seeing where the ground moves and where towns grow helps owners spend limited inspection and repair budgets where they matter most.
In depth
Urban work draws on two very different strengths of Earth observation. Optical and radar images map what has been built, and radar interferometry measures how it moves. Thermal images add how hot it gets, and elevation models add how tall it is.
Mapping where people build
Global maps of human settlements are now made automatically. The Global Human Settlement Layer framework extracts built-up areas from high and very high resolution images. In its first operational test it mapped 24.3 million square kilometres on four continents, home to an estimated 1.3 billion people, from imagery between 0.5 and 10 m [1]. The Global Urban Footprint, a binary settlement mask at about 12 m, was derived automatically from more than 180,000 TanDEM-X and TerraSAR-X radar images collected in 2011 and 2012, and reached an overall accuracy of about 85 per cent [2].
- What is measured
- Whether each pixel is built up, and in finer products the footprint and height of buildings.
- Data
- Multispectral and radar images at about 10 m for extent, very high resolution optical imagery for footprints, and elevation models for height.
- How often
- Annual or multi-year maps.
- Limits
- Informal settlements, scattered rural buildings and the difference between residential and commercial use are hard to tell from above.
- Who uses it
- Planners, statistical offices, utilities, insurers and humanitarian agencies.
Ground and building movement
Persistent scatterer interferometry picks out reflectors that stay stable through a long series of radar images, which in towns are mostly buildings and structures, and measures their movement. On these points millimetric terrain motion can be detected once the atmosphere's contribution has been estimated and removed [3]. A review of the technique covers its algorithms, the deformation rates it can follow, the thermal expansion of structures that it also records, and the validation that has made it acceptable for commercial use [4]. Since then such measurements have grown into wide-area services, of which the Copernicus European Ground Motion Service, built on Sentinel-1, is the largest [5].
- What is measured
- The movement of each persistent scatterer along the radar's line of sight, as a rate and a time series.
- Data
- Long stacks of radar images processed by interferometry, with finer radar for single structures.
- How often
- Updated as images are added, every few days to weeks per orbit.
- Limits
- Points are dense on buildings and sparse on fields and in forests. Only motion along the line of sight is seen directly, and fast movement between passes can be missed.
- Who uses it
- Engineers and asset owners, geological surveys, mining and tunnelling contractors, and insurers.
Bridges and critical structures
Interferometry can follow individual structures. A study of the Morandi bridge in Genoa, Italy, which collapsed on 14 August 2018, used radar data from COSMO-SkyMed, Sentinel-1 and the earlier Envisat to survey relative displacements across the bridge over 15 years. It found that deformation of the structure increased over time before the collapse, and that the deck next to the pier that failed had shown increasing relative displacements since 2015 [6].
- What is measured
- Relative displacement between points on a structure and the seasonal thermal movement of the deck.
- Data
- High resolution radar stacks from more than one orbit direction, processed by interferometry.
- How often
- With each new image, building into a record over years.
- Limits
- Interpreting the movement of a structure needs structural engineers, and a satellite record supports inspection rather than replacing it.
- Who uses it
- Highway and rail authorities, bridge owners and their engineers.
Urban heat
Towns are warmer than the countryside around them, and thermal images show the pattern street by street. A review of thermal remote sensing of urban climates sets out what such images measure, the temperature of the surfaces the sensor can see, and why that differs from the air temperature people feel [7].
- What is measured
- Land surface temperature, by day and at night.
- Data
- Thermal imagery, with multispectral data for the vegetation and surfaces that explain it.
- How often
- Each clear overpass, chosen for hot spells.
- Limits
- Satellites see roofs and treetops more than walls and streets, and surface temperature is not air temperature.
- Who uses it
- City planners, public health teams and designers of green spaces.
References
- Pesaresi, M., Huadong, G., Blaes, X. et al. (2013) A Global Human Settlement Layer From Optical HR/VHR RS Data: Concept and First Results. IEEE Journal of Selected Topics in Applied Earth Observations and Remote Sensing, 6(5), 2102-2131. https://doi.org/10.1109/JSTARS.2013.2271445
- Esch, T., Heldens, W., Hirner, A. et al. (2017) Breaking new ground in mapping human settlements from space - The Global Urban Footprint. ISPRS Journal of Photogrammetry and Remote Sensing, 134, 30-42. https://doi.org/10.1016/j.isprsjprs.2017.10.012
- Ferretti, A., Prati, C. and Rocca, F. (2001) Permanent scatterers in SAR interferometry. IEEE Transactions on Geoscience and Remote Sensing, 39(1), 8-20. https://doi.org/10.1109/36.898661
- Crosetto, M., Monserrat, O., Cuevas-González, M., Devanthéry, N. and Crippa, B. (2016) Persistent Scatterer Interferometry: A review. ISPRS Journal of Photogrammetry and Remote Sensing, 115, 78-89. https://doi.org/10.1016/j.isprsjprs.2015.10.011
- Crosetto, M., Solari, L., Mróz, M. et al. (2020) The Evolution of Wide-Area DInSAR: From Regional and National Services to the European Ground Motion Service. Remote Sensing, 12(12), 2043. https://doi.org/10.3390/rs12122043
- Milillo, P., Giardina, G., Perissin, D. et al. (2019) Pre-Collapse Space Geodetic Observations of Critical Infrastructure: The Morandi Bridge, Genoa, Italy. Remote Sensing, 11(12), 1403. https://doi.org/10.3390/rs11121403
- Voogt, J. A. and Oke, T. R. (2003) Thermal remote sensing of urban climates. Remote Sensing of Environment, 86(3), 370-384. https://doi.org/10.1016/S0034-4257(03)00079-8