Earth observation guideApplications
Defence and security
Security work asks what has changed, where and when. Satellites answer without needing access to the ground, and radar answers in any weather.
The basics
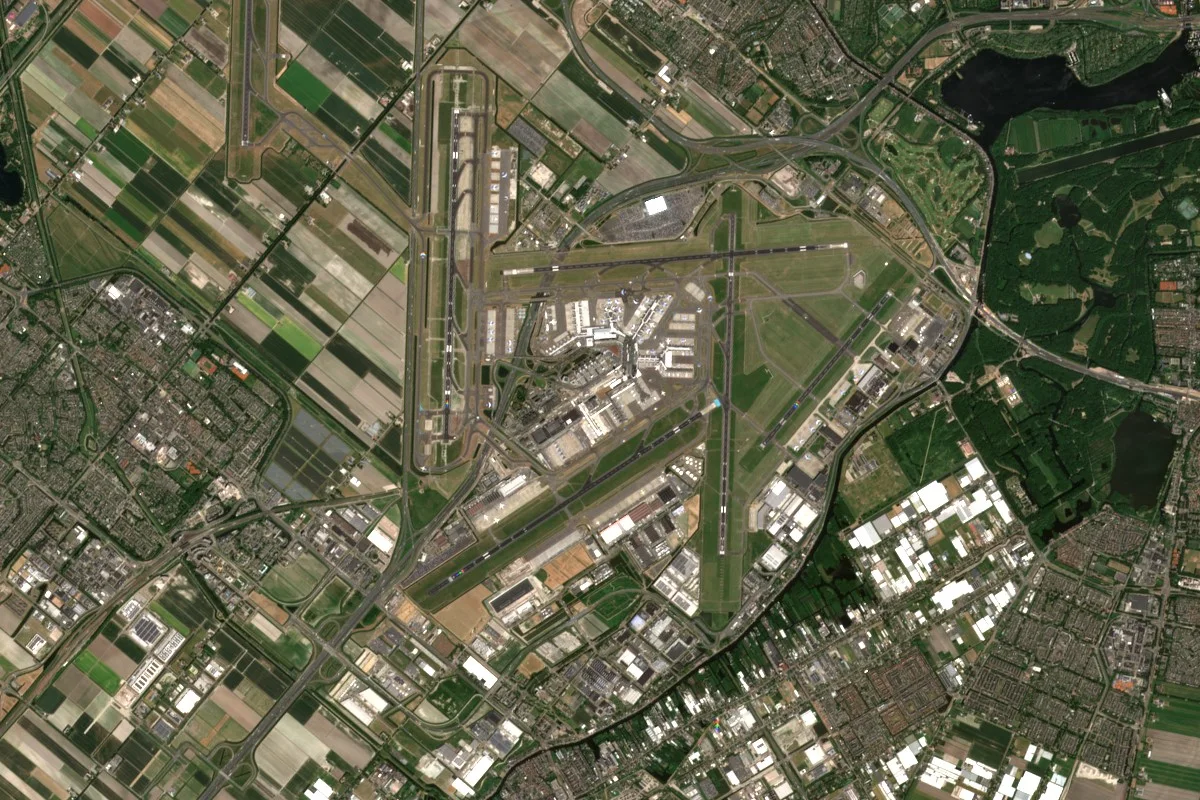
Much of security work is about noticing change. A new building, vehicles gathered where there were none, ships waiting off a coast. Satellites can look at almost anywhere without asking permission or putting anyone at risk, and comparing today's picture with last week's shows what is new. Radar satellites keep watching at night and through cloud. The same pictures also make accurate maps of the ground, which are needed for planning anything from a rescue to a new road. How much detail a picture shows matters a great deal, and the airport below shows why.
Why it matters
Knowing what has changed, quickly and without putting people at risk, supports security planning, disaster relief and the monitoring of agreements. Commercial and open satellite data now provide much of that knowledge.
In depth
Defence and security users draw on the same data as civil users, often the same images, and their methods are published in the open literature. What differs is the emphasis on timeliness, on detail and on detecting change. This page covers the civil, openly documented techniques.
Seeing enough detail
The detail needed depends on the question. Whether a large site is active can be judged at 10 m, counting vehicles needs about a metre, and recognising their type needs finer still. The resolutions page explains the trade-offs. Radar adds independence from light and weather. A synthetic aperture radar provides high resolution images day and night and in all weather [1], and Sentinel-1 offers that routinely at medium resolution, typically 10 m [2].
- What is measured
- Whatever the image resolves, from the extent of a site to the shape of a single vehicle.
- Data
- Very high resolution optical imagery at 0.3 to 1 m and high resolution radar, with open 10 m data for wide-area context.
- How often
- As often as the question needs and the constellation allows, from several times a day to weekly.
- Limits
- Finer detail means smaller footprints, so wide areas cannot be watched in fine detail all the time.
- Who uses it
- Defence and intelligence analysts, border and customs agencies and humanitarian organisations.
Change detection
The simplest way to find what is new is to compare two images of the same place. A review of change detection techniques found image differencing, principal component analysis and post-classification comparison to be the most common methods, with spectral mixture analysis, neural networks and integration with geographic information systems becoming important. It concluded that no single approach suits every case, so methods are compared for each application [3].
- What is measured
- Differences in reflectance, backscatter or classified land cover between dates.
- Data
- Repeated optical, multispectral or radar images from similar viewing geometry.
- How often
- With every new image of a watched site.
- Limits
- Seasons, shadows, viewing angle and registration errors all create changes that are not real, which is why images are matched in season and geometry.
- Who uses it
- Analysts watching sites over time, in defence as in civil mapping.
Coherent change detection
Radar interferometry can detect changes too subtle to see in a single image. When nothing has disturbed a surface between two passes, the phase of the echoes stays alike and coherence is high. Disturbance, from building damage to ground being worked, lowers it. A study using Sentinel-1 found that coherence falls slowly with time anyway, but drops markedly after a disaster, and that this drop indicates damaged buildings [4]. After an earthquake, such maps have been delivered to responding agencies within days [5].
- What is measured
- Interferometric coherence between radar passes from the same orbit.
- Data
- Pairs or stacks of radar images from the same orbit and mode.
- How often
- Each repeat pass of the same orbit.
- Limits
- Vegetation, rain and wind also lower coherence, so results are clearest on bare ground and in built-up areas.
- Who uses it
- Damage assessment teams, and analysts looking for activity that leaves no visible trace.
Maritime awareness
Knowing what is at sea is a security task as much as a commercial one. Satellite radar provides ship detection at high resolution over wide swaths in all weather, and combining it with ship identification broadcasts shows which vessels are not reporting [6]. Globally, 72 to 76 per cent of industrial fishing vessels are not publicly tracked [7]. The maritime page has a ship detection demonstration.
Terrain and mapping
Accurate elevation models underpin mapping, line-of-sight analysis, flight planning and the correction of every other image. The TanDEM-X mission used two radar satellites flying in close formation as a single-pass interferometer, acquired all land surfaces at least twice between December 2010 and early 2015, and completed a global elevation model in September 2016 [8]. The elevation page explains the methods.
- What is measured
- Height of the surface, including buildings and trees, and with further processing of the bare ground.
- Data
- Radar interferometry, stereo optical imagery and elevation products.
- How often
- Once, then refreshed where the ground or buildings change.
- Limits
- A surface model includes trees and buildings, so the bare ground beneath them has to be estimated. Steep terrain and dense forest have larger errors.
- Who uses it
- Mapping agencies, mission planners and emergency services.
References
- Moreira, A., Prats-Iraola, P., Younis, M. et al. (2013) A tutorial on synthetic aperture radar. IEEE Geoscience and Remote Sensing Magazine, 1(1), 6-43. https://doi.org/10.1109/MGRS.2013.2248301
- Torres, R., Snoeij, P., Geudtner, D. et al. (2012) GMES Sentinel-1 mission. Remote Sensing of Environment, 120, 9-24. https://doi.org/10.1016/j.rse.2011.05.028
- Lu, D., Mausel, P., Brondízio, E. and Moran, E. (2004) Change detection techniques. International Journal of Remote Sensing, 25(12), 2365-2401. https://doi.org/10.1080/0143116031000139863
- Washaya, P., Balz, T. and Mohamadi, B. (2018) Coherence Change-Detection with Sentinel-1 for Natural and Anthropogenic Disaster Monitoring in Urban Areas. Remote Sensing, 10(7), 1026. https://doi.org/10.3390/rs10071026
- Yun, S.-H., Hudnut, K., Owen, S. et al. (2015) Rapid Damage Mapping for the 2015Mw 7.8 Gorkha Earthquake Using Synthetic Aperture Radar Data from COSMO - SkyMed and ALOS-2 Satellites. Seismological Research Letters, 86(6), 1549-1556. https://doi.org/10.1785/0220150152
- Brusch, S., Lehner, S., Fritz, T. et al. (2011) Ship Surveillance With TerraSAR-X. IEEE Transactions on Geoscience and Remote Sensing, 49(3), 1092-1103. https://doi.org/10.1109/TGRS.2010.2071879
- Paolo, F. S., Kroodsma, D., Raynor, J. et al. (2024) Satellite mapping reveals extensive industrial activity at sea. Nature, 625(7993), 85-91. https://doi.org/10.1038/s41586-023-06825-8
- Rizzoli, P., Martone, M., Gonzalez, C. et al. (2017) Generation and performance assessment of the global TanDEM-X digital elevation model. ISPRS Journal of Photogrammetry and Remote Sensing, 132, 119-139. https://doi.org/10.1016/j.isprsjprs.2017.08.008