Earth observation guideApplications
Floods and disasters
When a flood, earthquake or fire strikes, the first question is what has been hit. Satellites answer it within hours to days, often through cloud and at night.
The basics
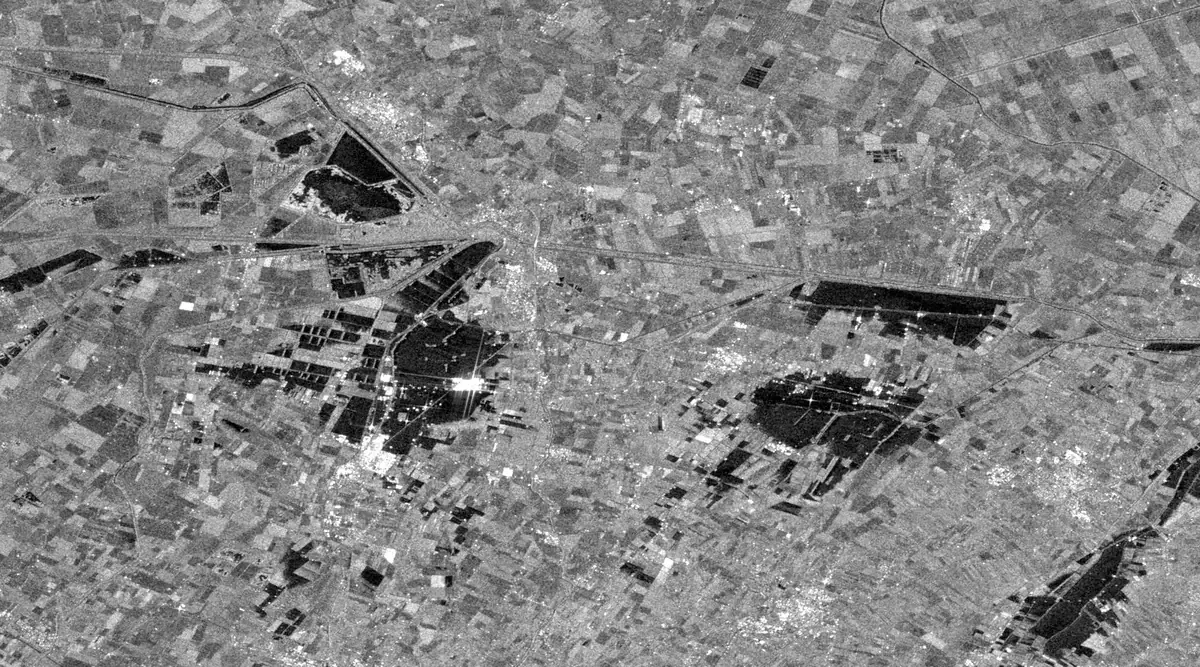
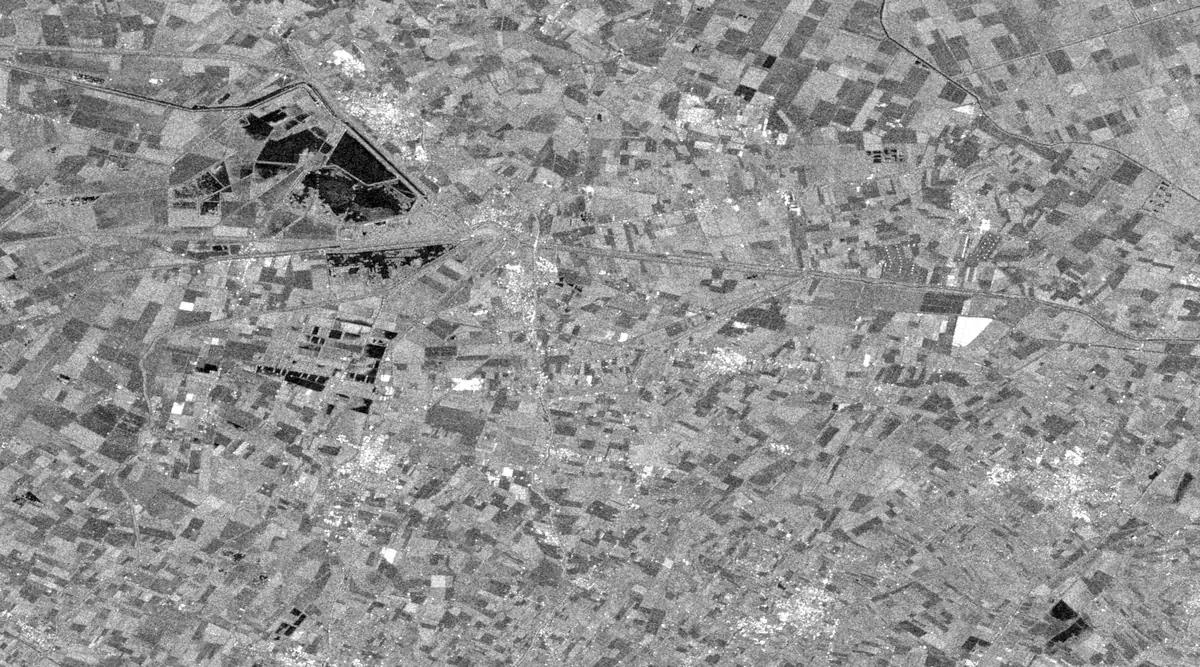
In a flood the first questions are how far the water has spread and who is cut off. The storm cloud that brings a flood also hides it from ordinary cameras, but a radar satellite sends its own signal through the cloud and records the echo. Calm open water reflects that signal away like a mirror, so flooded fields show up as black patches. Comparing a picture taken during the flood with one from a few weeks before shows exactly which land is newly under water. The same idea of comparing before and after helps rescue teams after earthquakes and fires, and tells insurers and aid agencies where to send people first.
Why it matters
In the first hours of a disaster, decisions about where to send rescuers and supplies are made with very little information. A map of what has actually been hit, delivered quickly, saves time when it matters most, and the same maps later help with recovery and planning.
In depth
Disaster mapping leans on radar because it works day and night in all weather, and the reliable acquisitions of Sentinel-1 make it particularly suited to emergency response [1]. A review of remote sensing for natural hazards covers the data types and methods used to map earthquakes, faulting, volcanic activity, landslides, floods and wildfire, and the damage each causes [2]. Fire is covered on the forestry and insurance pages.
Flood extent
Open water scatters the radar pulse away from the sensor and so returns a low backscatter coefficient, which separates it from land by a threshold or by change detection against an earlier image. Because a single global threshold can miss local differences across a large scene, one approach splits the image into tiles, derives the threshold from the tiles that hold both water and land, and refines the result by segmentation, with no training data needed [3]. An automated Sentinel-1 processing chain delivered flood maps less than 45 minutes after new data became available, with overall accuracies between 94.0 and 96.1 per cent at test sites on the border between Greece and Turkey [4].
- What is measured
- Radar backscatter, and its drop from before to during the flood.
- Data
- Radar at 5 to 20 m, with multispectral water indices when the sky clears.
- How often
- Each pass over the flood, every few days with open missions and more often with commercial constellations.
- Limits
- Wind roughens water and brightens it, flooded vegetation and towns can brighten through double bounces, and radar shadow hides some ground. A review of microwave flood mapping discusses these limits [5].
- Who uses it
- Civil protection and emergency services, river authorities, aid agencies and insurers.
Floods in towns
Towns are where floods do most harm and where radar has most trouble. Because a radar looks sideways, buildings hide some of the street behind them in shadow and fold others into layover. Water between buildings can instead raise the signal, as the pulse bounces off the water and then off a wall back to the sensor. A study of urban flooding tested whether this double scattering reveals flooding in layover areas, using a SAR simulator on a laser height map of the town to predict where the bright double-bounce lines should fall [6].
- What is measured
- Changes in double-bounce brightness along building walls, interpreted with a 3D model of the town.
- Data
- High resolution radar and a detailed elevation model of buildings.
- How often
- Each pass, if a suitable model of the town already exists.
- Limits
- Needs fine radar and a building model, and remains less reliable than flood mapping in open country.
- Who uses it
- Urban flood modellers and emergency planners.
Flood depth
A flood map shows where the water is, not how deep it is, and depth drives both rescue and repair costs. The Floodwater Depth Estimation Tool takes the edge of the flooded area from the map, reads the ground height there from an elevation model to give the water surface, and subtracts the ground height inside the flood. Tests against hydraulic simulations showed accurate depths in many settings but considerable bias where the flood edge did not line up with the elevation model [7].
- What is measured
- Water surface height at the flood edge, minus ground height inside the flood.
- Data
- A flood extent map and an elevation model, ideally a fine bare-earth terrain model.
- How often
- Once per flood map.
- Limits
- Only as good as the elevation model and the flood edge, and coarse elevation data blur shallow depths.
- Who uses it
- Emergency responders, loss adjusters and flood modellers.
Earthquake damage
Radar interferometry measures how alike two radar images are, a quantity called coherence. Standing buildings keep their coherence from one pass to the next, while collapsed ones lose it. After the 2015 Gorkha earthquake in Nepal, damage proxy maps from the change in coherence were produced rapidly from radar images taken four and nine days after the main shock, checked against independent damage analyses, and released to responding agencies, which used them to set inspection priorities [8]. The same coherence change detection works with open Sentinel-1 data, where a marked loss of coherence after an event indicates damaged buildings [9].
- What is measured
- Interferometric coherence before and after the event.
- Data
- Pairs of radar images from the same orbit, and very high resolution optical images to confirm damage.
- How often
- The first pass after the event, compared with archived passes.
- Limits
- Coherence also falls with vegetation, rain and time, so the map is a proxy that flags areas for inspection, not a count of damaged buildings.
- Who uses it
- Search and rescue coordinators, governments and humanitarian agencies, and insurers.
Rapid mapping in practice
The science is rarely the bottleneck. A review of hazard mapping noted that remote sensing is used operationally for some monitoring programmes, but that acquiring data quickly and delivering a robust product to emergency services remain difficult [2]. That is why automated chains like the one above, and archives that already hold a recent image of the area from before the event, matter as much as the sensor.
Before, 10 May 2023
During, 22 May 2023
References
- Torres, R., Snoeij, P., Geudtner, D. et al. (2012) GMES Sentinel-1 mission. Remote Sensing of Environment, 120, 9-24. https://doi.org/10.1016/j.rse.2011.05.028
- Joyce, K. E., Belliss, S. E., Samsonov, S. V., McNeill, S. J. and Glassey, P. J. (2009) A review of the status of satellite remote sensing and image processing techniques for mapping natural hazards and disasters. Progress in Physical Geography: Earth and Environment, 33(2), 183-207. https://doi.org/10.1177/0309133309339563
- Martinis, S., Twele, A. and Voigt, S. (2009) Towards operational near real-time flood detection using a split-based automatic thresholding procedure on high resolution TerraSAR-X data. Natural Hazards and Earth System Sciences, 9(2), 303-314. https://doi.org/10.5194/nhess-9-303-2009
- Twele, A., Cao, W., Plank, S. and Martinis, S. (2016) Sentinel-1-based flood mapping: a fully automated processing chain. International Journal of Remote Sensing, 37(13), 2990-3004. https://doi.org/10.1080/01431161.2016.1192304
- Schumann, G. J. P. and Moller, D. K. (2015) Microwave remote sensing of flood inundation. Physics and Chemistry of the Earth, Parts A/B/C, 83-84, 84-95. https://doi.org/10.1016/j.pce.2015.05.002
- Mason, D. C., Giustarini, L., Garcia-Pintado, J. and Cloke, H. L. (2014) Detection of flooded urban areas in high resolution Synthetic Aperture Radar images using double scattering. International Journal of Applied Earth Observation and Geoinformation, 28, 150-159. https://doi.org/10.1016/j.jag.2013.12.002
- Cohen, S., Brakenridge, G. R., Kettner, A. et al. (2018) Estimating Floodwater Depths from Flood Inundation Maps and Topography. JAWRA Journal of the American Water Resources Association, 54(4), 847-858. https://doi.org/10.1111/1752-1688.12609
- Yun, S.-H., Hudnut, K., Owen, S. et al. (2015) Rapid Damage Mapping for the 2015Mw 7.8 Gorkha Earthquake Using Synthetic Aperture Radar Data from COSMO - SkyMed and ALOS-2 Satellites. Seismological Research Letters, 86(6), 1549-1556. https://doi.org/10.1785/0220150152
- Washaya, P., Balz, T. and Mohamadi, B. (2018) Coherence Change-Detection with Sentinel-1 for Natural and Anthropogenic Disaster Monitoring in Urban Areas. Remote Sensing, 10(7), 1026. https://doi.org/10.3390/rs10071026