Earth observation guideApplications
Insurance
Insurers need to know what is exposed before an event and what was hit after it. Satellite data inform both, from flood exposure maps to the extent of a fire.
The basics
After a storm, fire or flood, an insurer has thousands of claims and too few people to check them on the ground. Satellite pictures taken before and after the event show which areas were hit within days, so claims can be sorted, checked and paid sooner. Before anything happens, the same data show which homes and businesses sit on ground that floods or slowly sinks, which helps set a fair price for cover. Some policies now pay out automatically when a satellite measurement, such as how dry the crops are, passes an agreed level, with no visit at all.
Why it matters
Faster, fairer claims and better-priced cover both depend on knowing what happened where. Satellite data give insurers an independent record of an event that does not depend on who reports it.
In depth
Insurance uses Earth observation at three points in its cycle. Before cover is written, it maps exposure and hazard. After an event, it maps the damage. For some products, the satellite measurement is itself the trigger for payment. The methods are those of the floods and disasters page, applied to a portfolio of insured sites.
Exposure and flood risk
Satellite flood records show where water has actually been. Daily images at 250 m were used to map 913 large floods between 2000 and 2018, a total inundated area of 2.23 million square kilometres with 255 to 290 million people directly affected. The population living where floods were observed grew by 58 to 86 million between 2000 and 2015, an increase of 20 to 24 per cent in the proportion of the world's population exposed, ten times higher than earlier estimates [1]. Combined with an elevation model, such records help check the flood models that insurers use to price cover.
- What is measured
- Where floods have occurred, how often, and how much property and population sit there.
- Data
- Archives of multispectral and radar flood maps, elevation models and building footprints from optical imagery.
- How often
- Updated as new events are mapped, and reviewed at each renewal.
- Limits
- Coarse daily images miss small and brief floods, and cloud hides many optical observations, so a satellite record understates the true flood history.
- Who uses it
- Underwriters, catastrophe modellers, reinsurers and public flood insurance schemes.
Loss assessment after an event
Remote sensing has repeatedly proved useful for mapping the damage caused by earthquakes, landslides, floods and wildfire, though delivering a robust product quickly is still the hard part [2]. For insurers the value is triage. A damage map sorts claims into areas that were clearly hit, areas that were spared and areas that need a visit, and very high resolution optical images can then confirm the state of individual buildings. Radar coherence maps, described on the floods and disasters page, have been used to set inspection priorities after an earthquake [3].
- What is measured
- Change between images taken before and after the event, by reflectance, backscatter or coherence.
- Data
- Radar for the first look through cloud, then very high resolution optical imagery at 0.3 to 1 m for buildings.
- How often
- As soon after the event as a clear or radar image allows.
- Limits
- Roof damage is visible from above, but damage to walls and contents often is not. The best results need a recent archive image from before the event.
- Who uses it
- Claims teams, loss adjusters and reinsurers estimating their share of an industry loss.
Wildfire
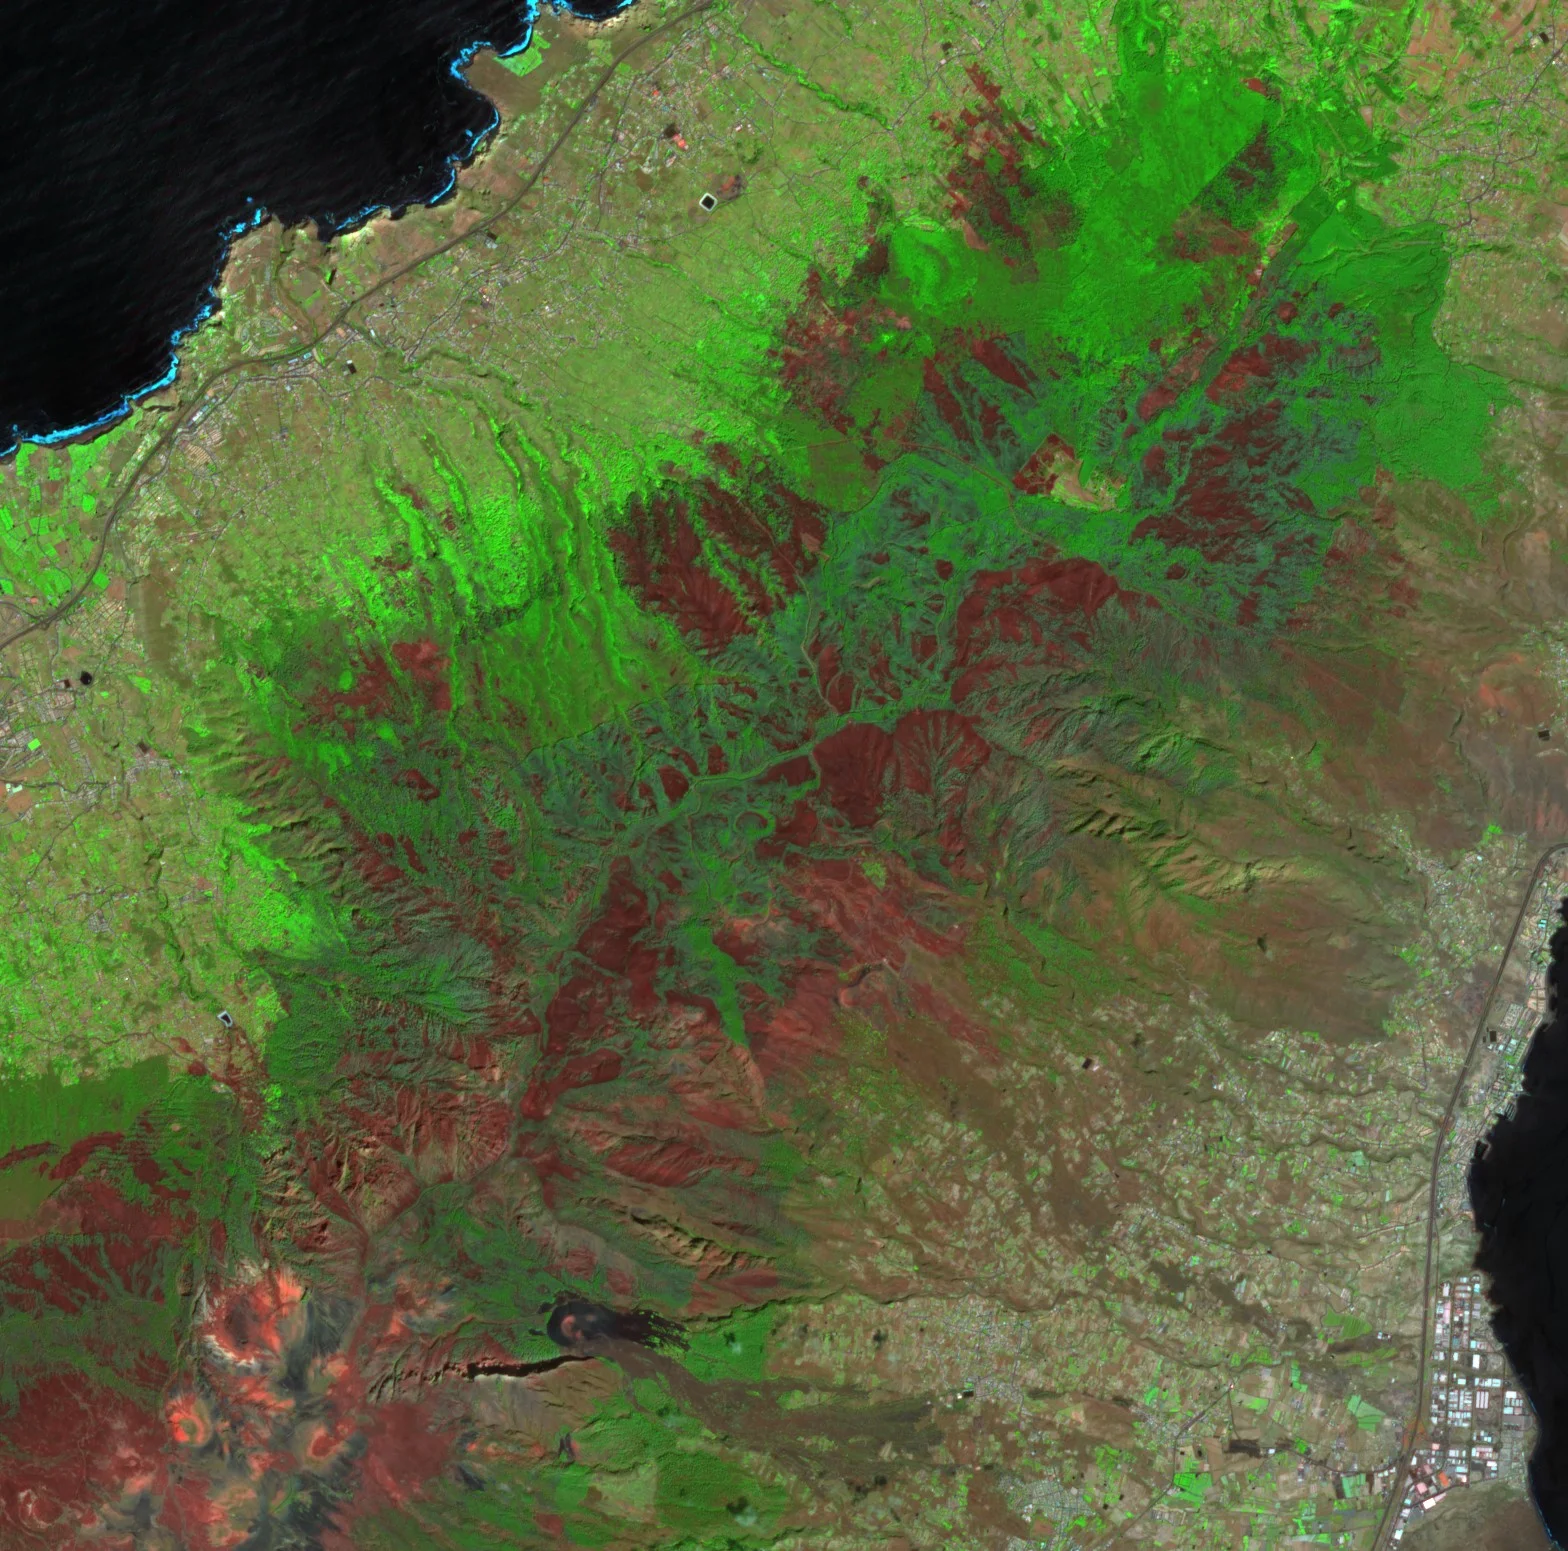
Fire scars are among the clearest of all changes to see from orbit. Burnt ground is bright in the shortwave infrared and dark in the near infrared, so the normalised burn ratio of the two bands falls sharply. The change in the ratio from before to after a fire, in its relative form, measures burn severity in a way that can be compared between landscapes [4]. The demonstration below shows the change on Tenerife.
- What is measured
- The perimeter of the burnt area and the severity of the burn within it.
- Data
- Multispectral imagery with shortwave infrared bands at 10 to 30 m, and very high resolution optical imagery for individual buildings.
- How often
- One clear image before and one after the fire.
- Limits
- Smoke can hide the scar for days, and whether a particular house survived needs a finer image than the 20 m shortwave infrared bands give.
- Who uses it
- Property and agricultural insurers, and forest owners with cover for standing timber.
Parametric cover
A parametric policy pays an agreed sum when a measured index passes a threshold, without assessing each loss. In agriculture the index is often a satellite estimate of crop condition or yield. A review describes how loss estimation for index insurance has moved from costly field sampling to weather and satellite data, and stresses that a contract is only as valuable as the index is at capturing losses when policyholders suffer most [5]. The mismatch between index and loss is the basis risk that the buyer carries. The agriculture page describes the crop measurements.
- What is measured
- An index agreed in advance, such as a vegetation index anomaly, a flooded area or rainfall.
- Data
- Long, consistent records, so that the chance of the index passing its threshold can be priced.
- How often
- Through the cover period, with payment once the index is confirmed.
- Limits
- Basis risk, and any change of sensor or processing during the record that shifts the index.
- Who uses it
- Insurers, governments and development agencies, often for farmers who could not otherwise get cover.
Subsidence and slow ground movement
Ground that sinks or slides by a few millimetres a year cracks walls and pipes long before anyone notices it. Persistent scatterer interferometry follows stable reflectors such as buildings through long series of radar images and can detect terrain motion of millimetres once the effect of the atmosphere is removed [6]. In Europe, the Copernicus European Ground Motion Service now provides such measurements over wide areas from Sentinel-1 [7].
- What is measured
- The rate and history of ground and building movement along the radar's line of sight.
- Data
- Long stacks of radar images processed by interferometry.
- How often
- Updated as new images join the stack, with regional services publishing periodic updates.
- Limits
- Measures only where there are stable reflectors, which are plentiful in towns and sparse in fields and forests, and only motion along the line of sight.
- Who uses it
- Property insurers pricing subsidence risk, mortgage lenders and surveyors.
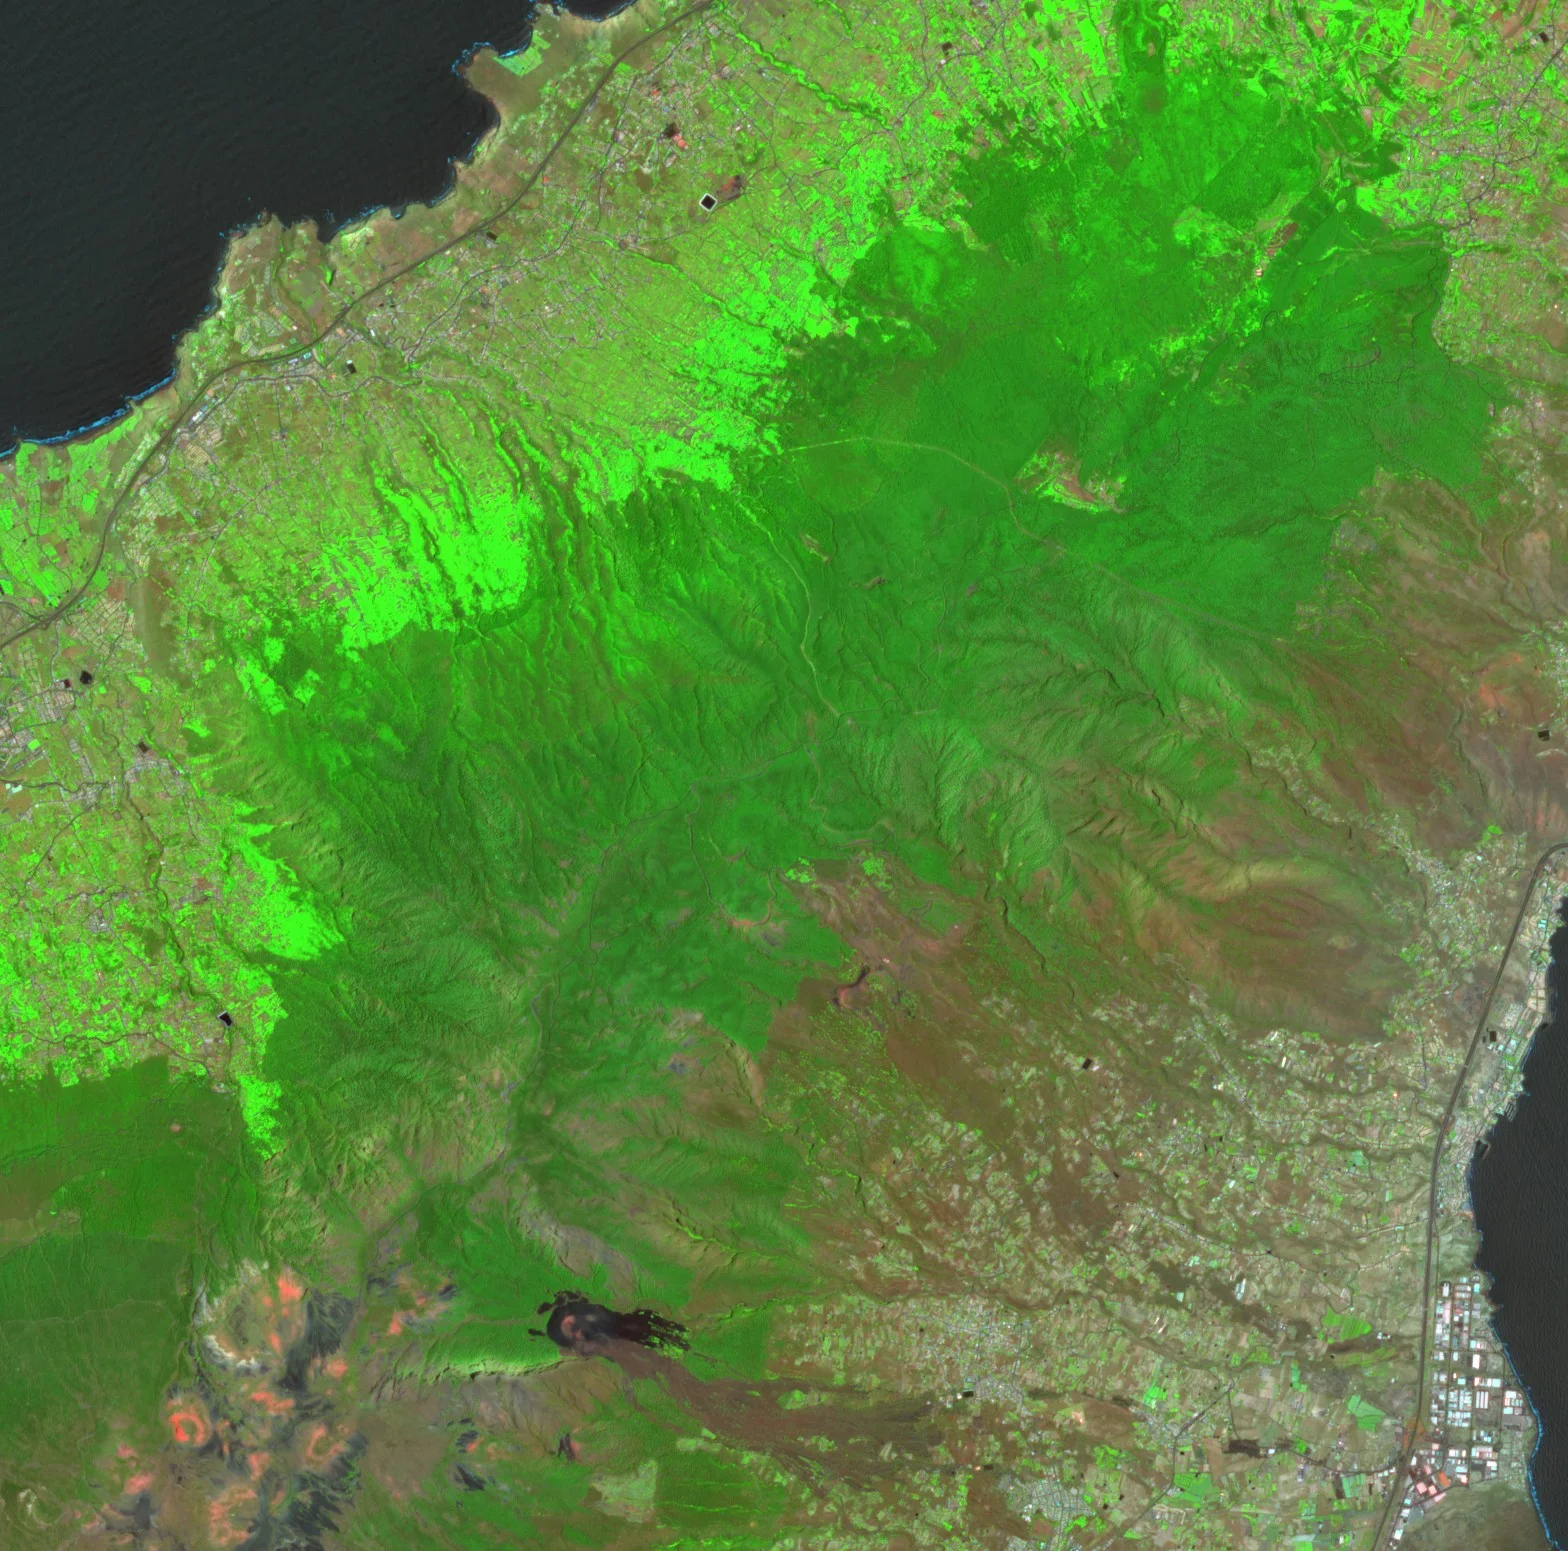
Before, 29 June 2023
After, 7 September 2023
References
- Tellman, B., Sullivan, J. A., Kuhn, C. et al. (2021) Satellite imaging reveals increased proportion of population exposed to floods. Nature, 596(7870), 80-86. https://doi.org/10.1038/s41586-021-03695-w
- Joyce, K. E., Belliss, S. E., Samsonov, S. V., McNeill, S. J. and Glassey, P. J. (2009) A review of the status of satellite remote sensing and image processing techniques for mapping natural hazards and disasters. Progress in Physical Geography: Earth and Environment, 33(2), 183-207. https://doi.org/10.1177/0309133309339563
- Yun, S.-H., Hudnut, K., Owen, S. et al. (2015) Rapid Damage Mapping for the 2015Mw 7.8 Gorkha Earthquake Using Synthetic Aperture Radar Data from COSMO - SkyMed and ALOS-2 Satellites. Seismological Research Letters, 86(6), 1549-1556. https://doi.org/10.1785/0220150152
- Miller, J. D. and Thode, A. E. (2007) Quantifying burn severity in a heterogeneous landscape with a relative version of the delta Normalized Burn Ratio (dNBR). Remote Sensing of Environment, 109(1), 66-80. https://doi.org/10.1016/j.rse.2006.12.006
- Benami, E., Jin, Z., Carter, M. R. et al. (2021) Uniting remote sensing, crop modelling and economics for agricultural risk management. Nature Reviews Earth & Environment, 2(2), 140-159. https://doi.org/10.1038/s43017-020-00122-y
- Ferretti, A., Prati, C. and Rocca, F. (2001) Permanent scatterers in SAR interferometry. IEEE Transactions on Geoscience and Remote Sensing, 39(1), 8-20. https://doi.org/10.1109/36.898661
- Crosetto, M., Solari, L., Mróz, M. et al. (2020) The Evolution of Wide-Area DInSAR: From Regional and National Services to the European Ground Motion Service. Remote Sensing, 12(12), 2043. https://doi.org/10.3390/rs12122043