Earth observation guideApplications
Financial services
Satellites give investors, lenders and analysts an independent view of economic activity and of the assets behind a loan or a claim, often sooner than official figures.
The basics
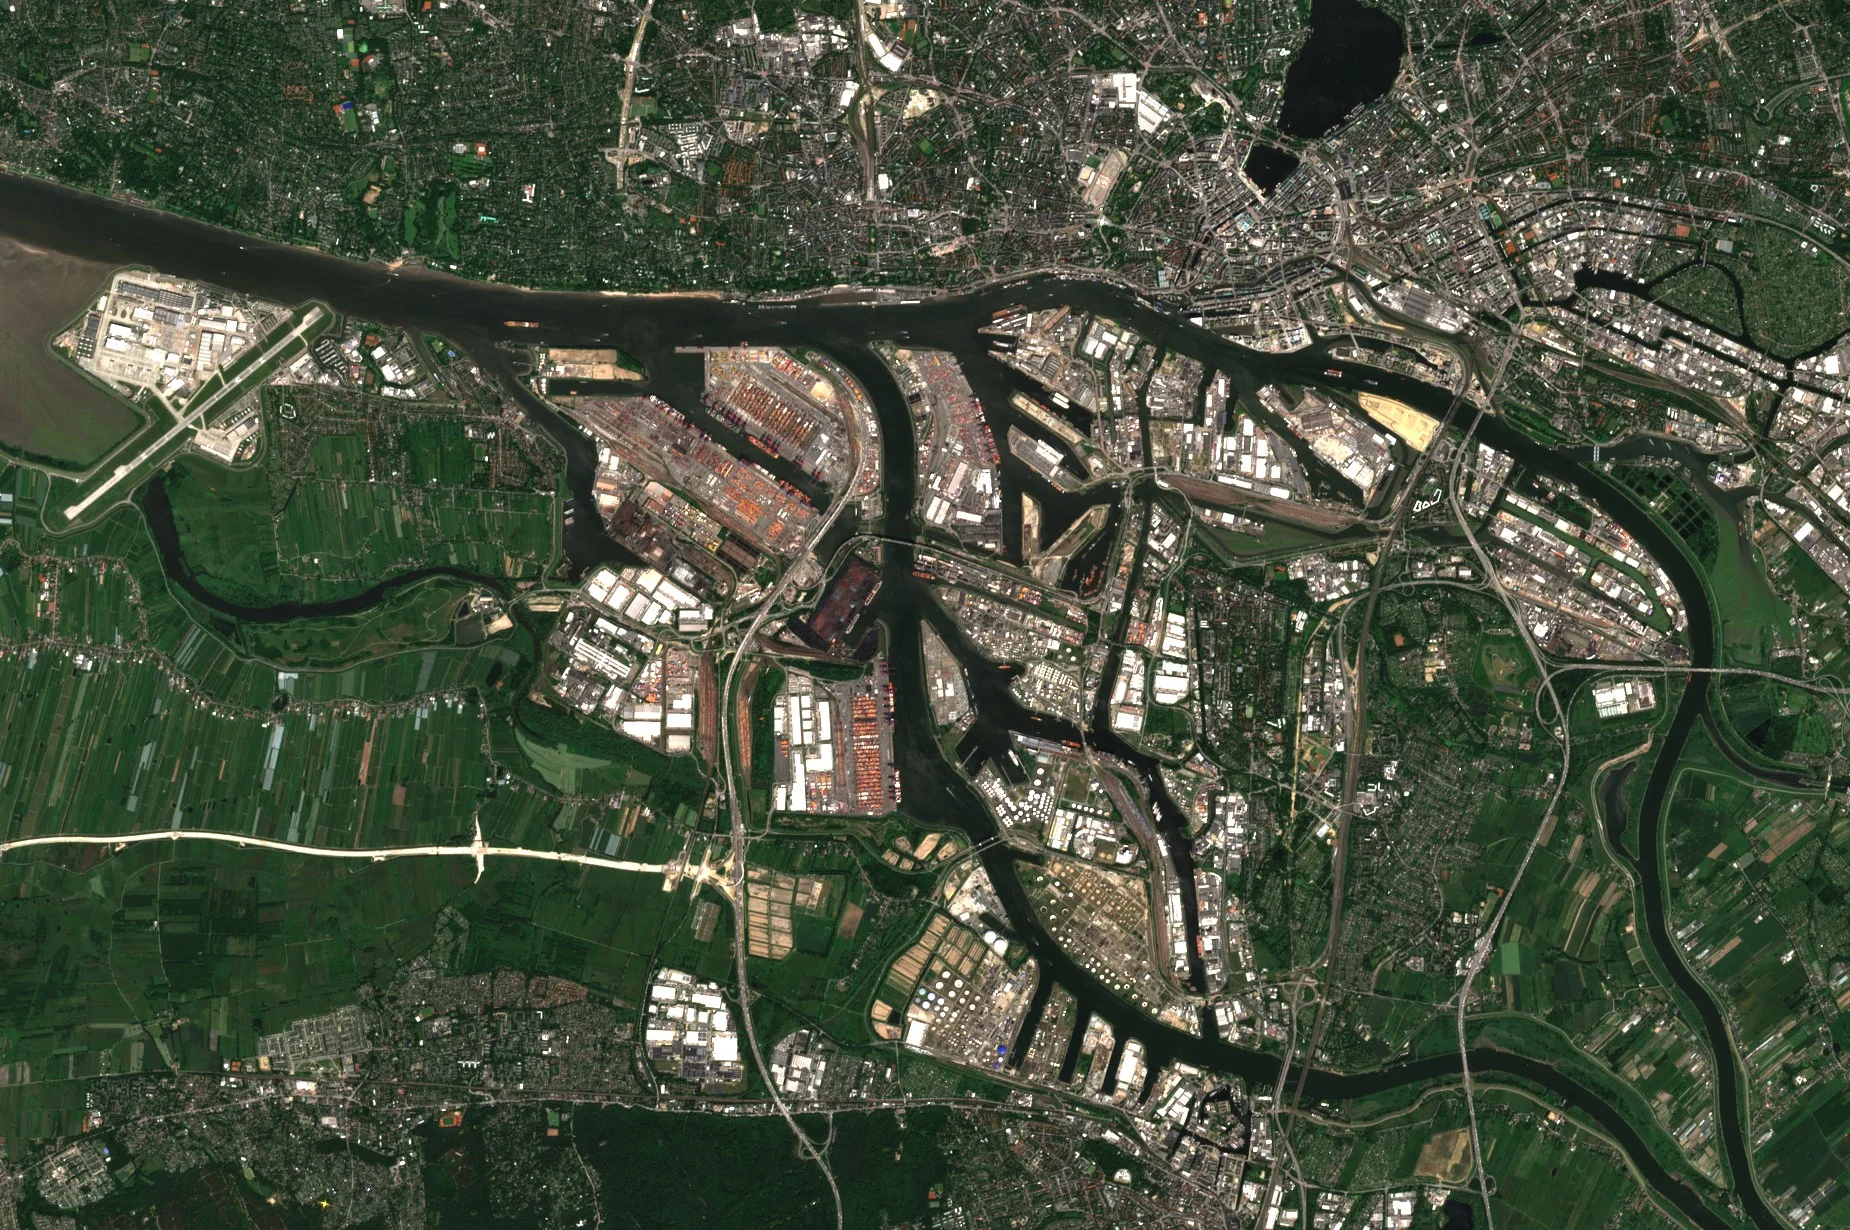
Official statistics on a country's economy arrive months late and are sometimes unreliable. A satellite does not wait for a report. It sees how brightly a region is lit at night, how full a port is, whether a new factory is being built and whether a farm that borrowed money is actually planted. Banks use these views to check what they are lending against, investors to judge a company's claims, and food and timber buyers to prove that what they sell did not come from freshly cleared forest.
Why it matters
Decisions about lending and investing are only as good as the information behind them. Satellite data offer a view that is independent of the company or country being assessed, consistent across the world and updated often.
In depth
Economists have taken up satellite data quickly. A review for economists describes how petabytes of imagery have become publicly accessible at increasing resolution, how algorithms for extracting social and economic information from it have become routine, and how cloud computing lets them run at global scale [1]. Financial firms use the same data for four broad purposes, below. Related uses are covered on the insurance, agriculture and mining and commodities pages.
Measuring economic activity
Light at night tracks economic activity. A statistical framework that uses growth in lights to improve measured income growth found that, for countries with good national accounts, lights add little, but for countries with the worst accounts the best estimate gives lights and official data roughly equal weight, and differs from official growth figures by as much as 3 percentage points a year. Lights also measure growth in regions and cities that official accounts do not cover [2]. The night lights page explains the measurement.
- What is measured
- Radiance of artificial light at night, summed over a country, region or city and followed over time.
- Data
- Night lights at around 500 m to 1 km for regions, and finer optical imagery for individual sites such as ports, car parks and factories.
- How often
- Monthly or annual composites for lights; site imagery as often as it is ordered.
- Limits
- Lights measure lighting, not output, so the link to income varies between places and over time, and agriculture and services may emit little light.
- Who uses it
- Macroeconomic analysts, sovereign debt investors and development banks.
Poverty and development
Where household surveys are rare, daytime imagery fills gaps. A convolutional neural network trained on survey and satellite data from Nigeria, Tanzania, Uganda, Malawi and Rwanda identified image features that explain up to 75 per cent of the variation in local consumption and asset wealth, using only publicly available data [3].
- What is measured
- Features in imagery, such as roofs, roads and farmland, that correlate with household wealth.
- Data
- High resolution optical imagery, often with night lights as an extra signal.
- How often
- Every year or few years, as new imagery and surveys arrive.
- Limits
- Models trained on one set of countries may not transfer to others, and they predict averages for villages or districts, not individual households.
- Who uses it
- Development finance institutions, impact investors and governments targeting aid.
Supply chains and deforestation rules
The European Union's deforestation regulation covers cattle, cocoa, coffee, oil palm, rubber, soya and wood, and products made from them. Operators must give the geolocation of the plots of land where the commodities were produced, as polygons for plots of more than four hectares, and the regulation names Earth observation data, such as those of the Copernicus programme, among the means of checking that products are deforestation-free [4]. Satellite forest maps and alerts, described on the forestry page, are the evidence behind such checks [5, 6].
- What is measured
- Whether forest cover inside each declared plot has changed since the regulation's cut-off date.
- Data
- Multispectral and radar time series at 10 to 30 m, and very high resolution optical images to resolve doubtful cases.
- How often
- Once for each shipment's plots, and continuously for the farms and forests a buyer sources from.
- Limits
- Only as good as the declared plot boundaries. Forest definitions, degradation and small plots are hard cases.
- Who uses it
- Importers and traders, banks financing commodity trade, and auditors.
Asset inventories and monitoring
Imagery can count assets that no register lists. Machine learning on a long series of remote sensing images located and verified 68,661 commercial, industrial and utility-scale solar installations worldwide, 432 per cent more facilities than previously available asset-level data held, with an estimated capacity of 423 gigawatts at the end of 2018 [7]. The same approach lets a lender watch the progress of a building site, a mine or a plantation it has financed, using the change detection methods described on the defence and security page.
- What is measured
- The presence, size and state of physical assets, and how they change.
- Data
- Multispectral images at 10 m for large assets, very high resolution optical imagery for small ones, and radar where cloud persists.
- How often
- Monthly or quarterly for project monitoring, and once for an inventory.
- Limits
- An image shows what is built, not who owns it or whether it is running at full capacity.
- Who uses it
- Lenders, project finance teams, equity analysts and investors assessing environmental, social and governance claims.
References
- Donaldson, D. and Storeygard, A. (2016) The View from Above: Applications of Satellite Data in Economics. Journal of Economic Perspectives, 30(4), 171-198. https://doi.org/10.1257/jep.30.4.171
- Henderson, J. V., Storeygard, A. and Weil, D. N. (2012) Measuring Economic Growth from Outer Space. American Economic Review, 102(2), 994-1028. https://doi.org/10.1257/aer.102.2.994
- Jean, N., Burke, M., Xie, M. et al. (2016) Combining satellite imagery and machine learning to predict poverty. Science, 353(6301), 790-794. https://doi.org/10.1126/science.aaf7894
- European Parliament and Council of the European Union (2023) Regulation (EU) 2023/1115 of 31 May 2023 on the making available on the Union market and the export from the Union of certain commodities and products associated with deforestation and forest degradation. Official Journal of the European Union, L 150, 206-247. https://eur-lex.europa.eu/eli/reg/2023/1115/oj
- Hansen, M. C., Potapov, P. V., Moore, R. et al. (2013) High-Resolution Global Maps of 21st-Century Forest Cover Change. Science, 342(6160), 850-853. https://doi.org/10.1126/science.1244693
- Reiche, J., Mullissa, A., Slagter, B. et al. (2021) Forest disturbance alerts for the Congo Basin using Sentinel-1. Environmental Research Letters, 16(2), 024005. https://doi.org/10.1088/1748-9326/abd0a8
- Kruitwagen, L., Story, K. T., Friedrich, J. et al. (2021) A global inventory of photovoltaic solar energy generating units. Nature, 598(7882), 604-610. https://doi.org/10.1038/s41586-021-03957-7