Earth observation guideApplications
Climate and environment
Many of the measurements that track a changing climate can only be made consistently from orbit, from shrinking lakes and moving ice to the gases in the air.
The basics
A thermometer in a garden tells you about that garden. To know how the whole planet is changing, the same measurement has to be made everywhere, in the same way, for decades. Satellites do that. They have recorded lakes filling and drying, glaciers speeding up, coastlines moving and forests burning, and they measure gases such as methane and nitrogen dioxide in the air above cities and industry. Governments use these records to report on their climate commitments, and businesses use them to understand the risks to their sites and supply chains.
Why it matters
Decisions about climate, water and land need evidence that is consistent across countries and decades. Satellite records provide much of it, and they are open for anyone to check.
In depth
Climate and environmental monitoring needs long, consistent and calibrated records more than it needs the finest detail. Most of the data types in this guide contribute, and forests, fire and land cover change are covered on the forestry page.
Essential climate variables
The Global Climate Observing System defined a set of essential climate variables, such as sea level, land cover, glaciers and greenhouse gases, whose records provide traceable, observation-based evidence for monitoring, mitigating, adapting to and attributing climate change. The concept has been adopted by the United Nations Framework Convention on Climate Change, the World Meteorological Organization and the space agencies that operate Earth observation satellites [1]. Many of the variables can only be measured globally from orbit.
Surface water and drought
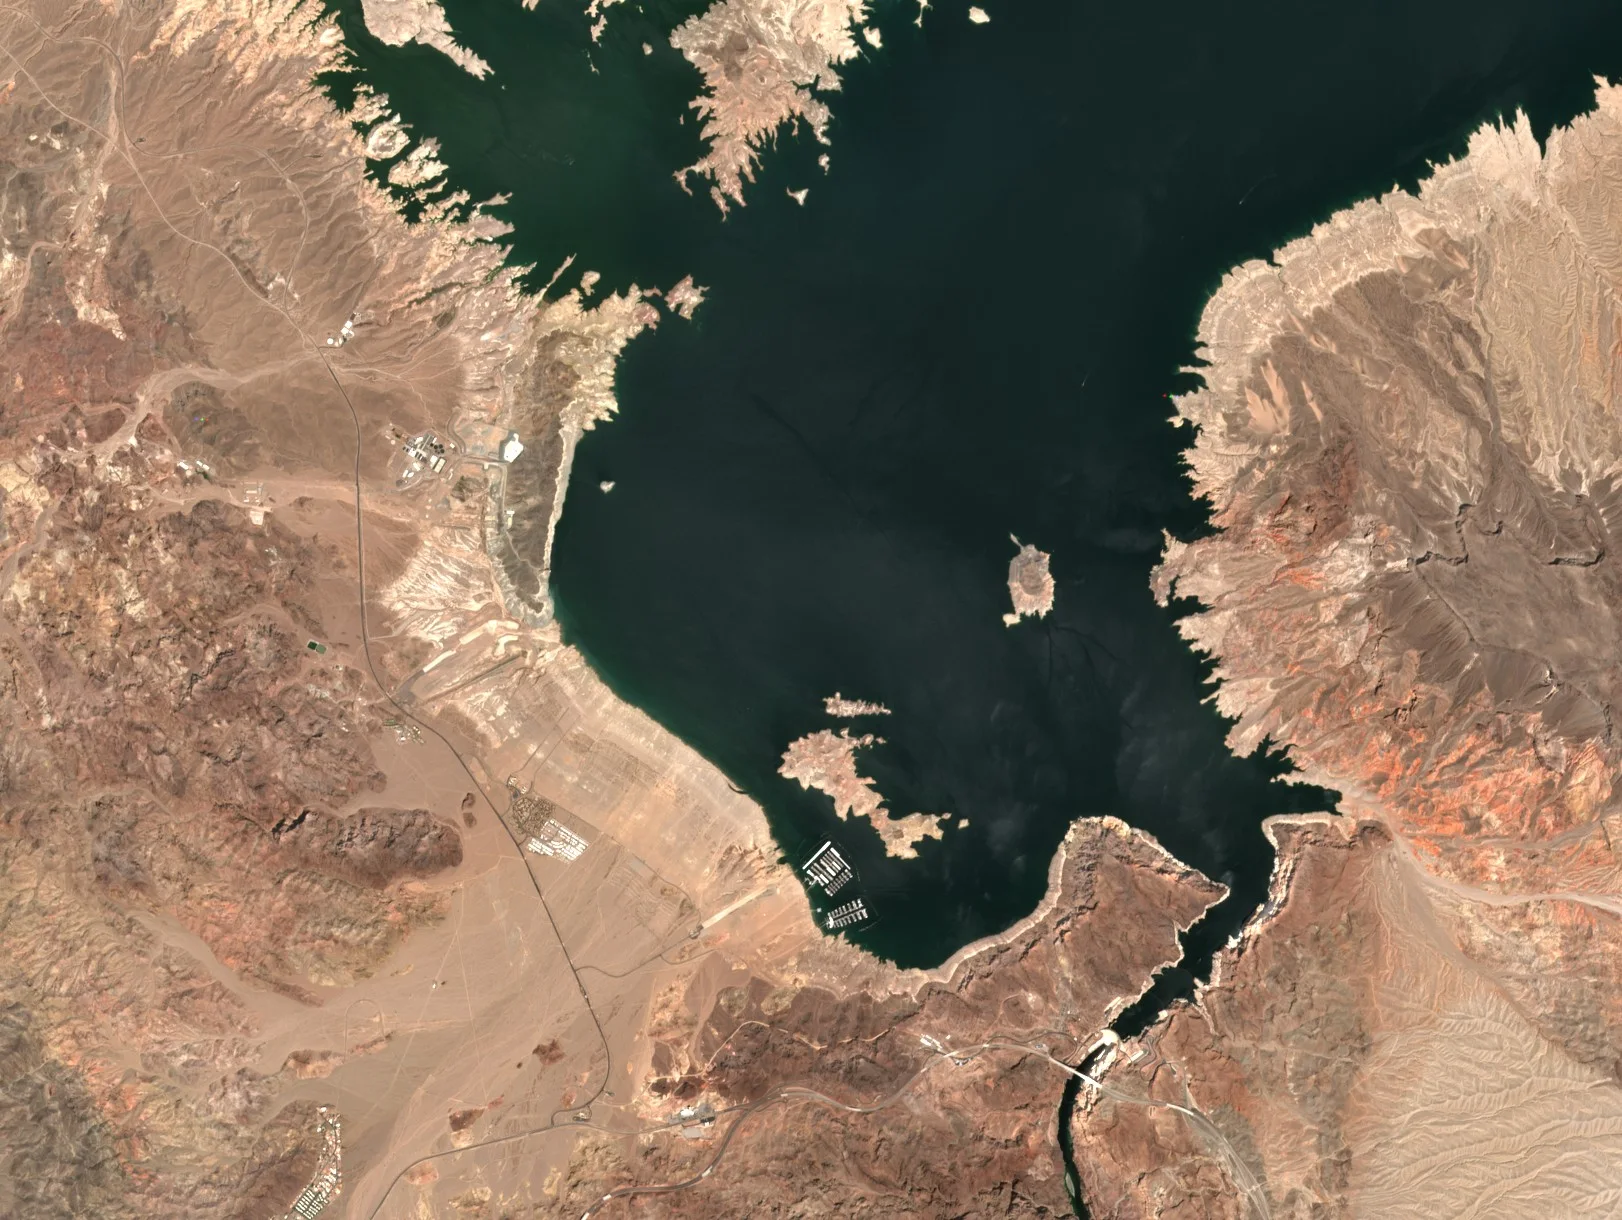
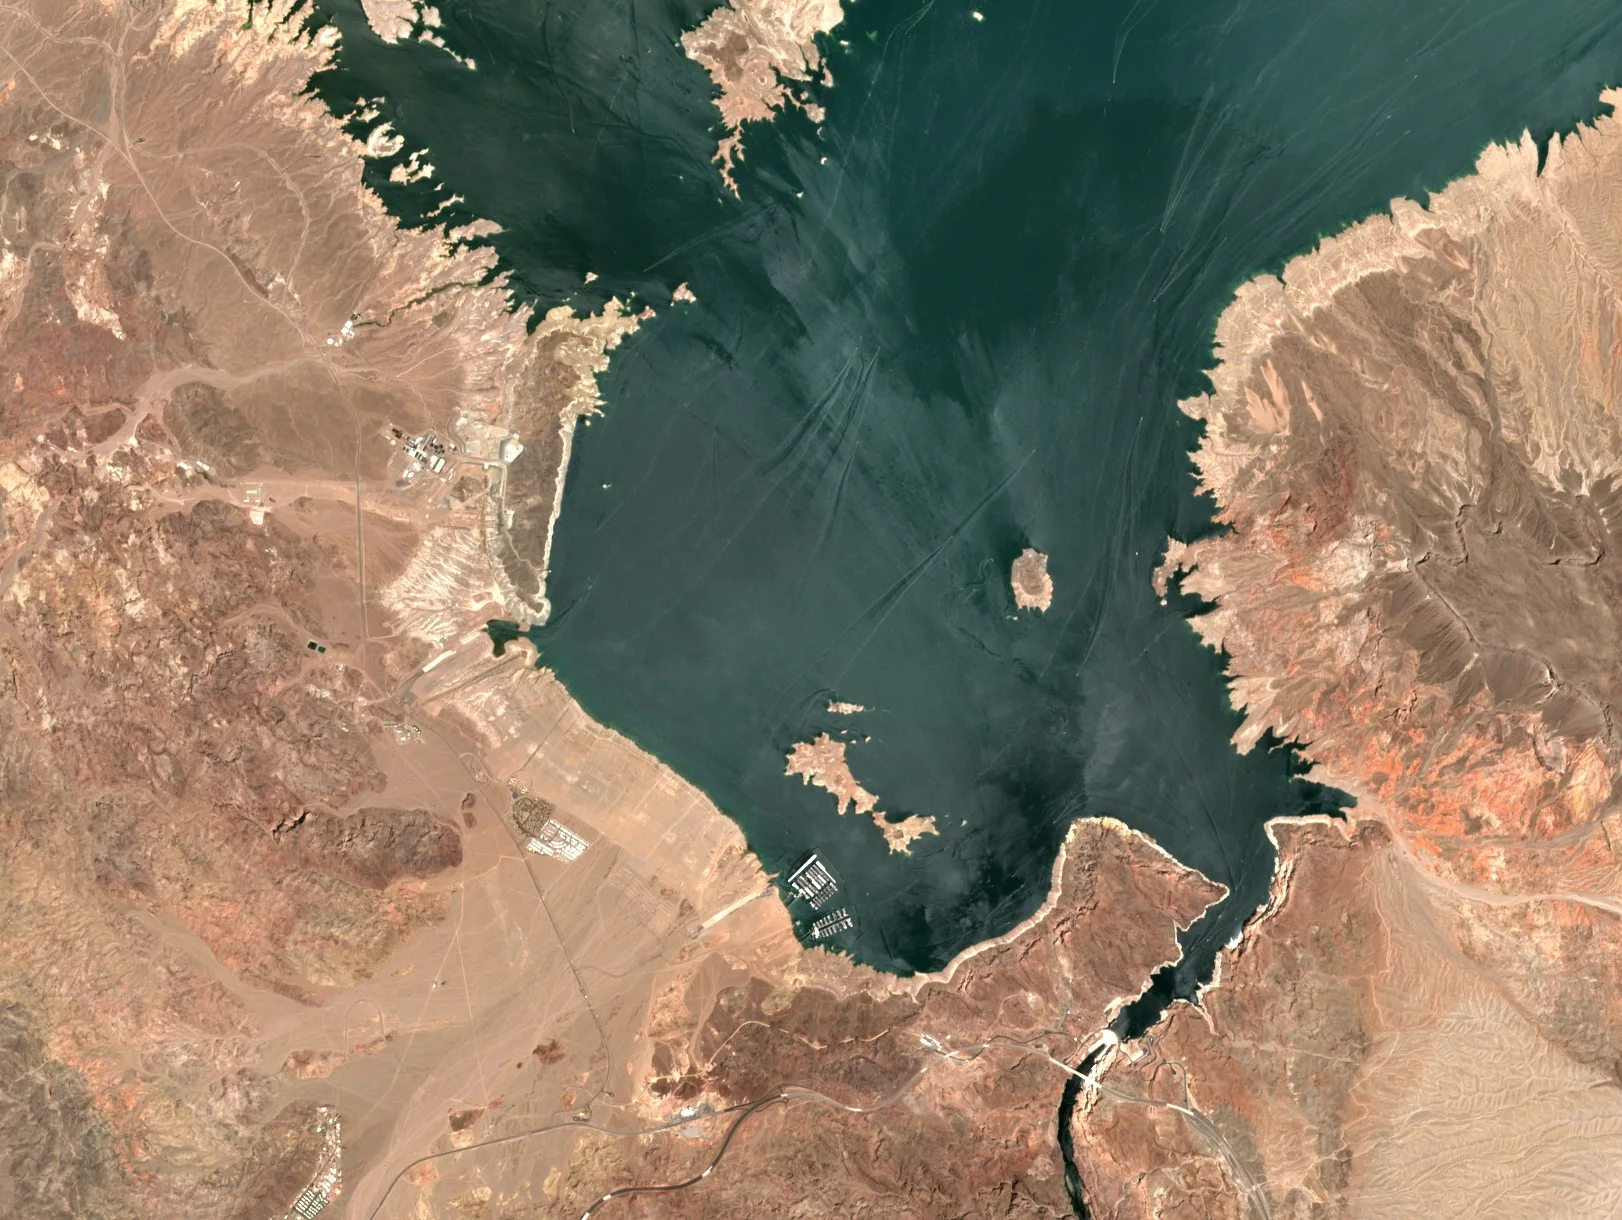
Water is easy to see from space, and long archives show how it changes. An analysis of more than three million Landsat images mapped surface water at 30 m month by month from 1984 to 2015. Permanent surface water disappeared from almost 90,000 square kilometres, while new permanent water bodies covering 184,000 square kilometres formed elsewhere, much of it in filling reservoirs. Over 70 per cent of the net loss was in the Middle East and Central Asia, linked to drought and to human actions such as river diversion, damming and unregulated withdrawal [2]. The water indices on the multispectral page are the basic tool.
- What is measured
- Whether each pixel is water, month by month, and from that the area of lakes, reservoirs and wetlands.
- Data
- Multispectral archives at 10 to 30 m, and radar where cloud persists.
- How often
- Every usable image, summarised monthly or yearly.
- Limits
- Area is not volume, so storage needs an elevation model of the basin. Cloud, ice and shadow cause gaps and errors.
- Who uses it
- Water authorities, hydropower operators, drought monitoring services and researchers.
Ice sheets and glaciers
Radar interferometry measures how fast ice flows. A mosaic built from data acquired during the International Polar Year of 2007 to 2009 mapped ice motion across all of Antarctica, and revealed tributary glaciers reaching hundreds to thousands of kilometres inland, a view that changed the understanding of how ice sheets flow [3].
- What is measured
- Ice velocity, and with other data the extent and thickness of ice.
- Data
- Radar and interferometry, which work through the polar night, and optical images for glacier outlines.
- How often
- Annual mosaics, with more frequent coverage of fast glaciers.
- Limits
- Fast or changing surfaces lose coherence between passes, and velocity along the radar's line of sight needs combining from several directions.
- Who uses it
- Glaciologists and the sea level projections that depend on them.
Coastlines
Beaches advance and retreat with storms and seasons, and over decades with sea level and sediment supply. The CoastSat toolkit extracts the position of the shoreline on sandy coasts from more than 30 years of Landsat and Sentinel-2 images, with an accuracy of about 10 m, and is aimed at coastal managers, engineers and scientists [4].
- What is measured
- The boundary between sand and water in each image, giving a time series of shoreline position.
- Data
- Multispectral archives at 10 to 30 m.
- How often
- Every usable image, many times a year.
- Limits
- Tide and wave run-up move the waterline between images, so results need correcting for tide. Accuracy of about 10 m is coarse for a narrow beach.
- Who uses it
- Coastal managers, engineers and scientists.
Greenhouse gases and air quality
Spectrometers that look down through the atmosphere measure gases by the light they absorb. TROPOMI on the Sentinel-5 Precursor satellite was designed for global observations of atmospheric composition for climate, air quality and ozone [5], and has found very large releases of methane from oil and gas sites that together account for 8 to 12 per cent of global methane emissions from oil and gas production [6]. The energy page covers methane from individual sites.
- What is measured
- Columns of gases such as methane, nitrogen dioxide, carbon monoxide and ozone.
- Data
- Atmospheric spectrometers at kilometre scale, and multispectral or hyperspectral imagers for large point sources.
- How often
- Daily global coverage for the atmospheric instruments.
- Limits
- Kilometre pixels average over many sources, cloud blocks the view, and turning a column into an emission rate needs wind data and modelling.
- Who uses it
- Environmental regulators, air quality forecasters, climate scientists and companies reporting emissions.
20 July 2019
23 August 2022
References
- Bojinski, S., Verstraete, M., Peterson, T. C. et al. (2014) The Concept of Essential Climate Variables in Support of Climate Research, Applications, and Policy. Bulletin of the American Meteorological Society, 95(9), 1431-1443. https://doi.org/10.1175/BAMS-D-13-00047.1
- Pekel, J.-F., Cottam, A., Gorelick, N. and Belward, A. S. (2016) High-resolution mapping of global surface water and its long-term changes. Nature, 540(7633), 418-422. https://doi.org/10.1038/nature20584
- Rignot, E., Mouginot, J. and Scheuchl, B. (2011) Ice Flow of the Antarctic Ice Sheet. Science, 333(6048), 1427-1430. https://doi.org/10.1126/science.1208336
- Vos, K., Splinter, K. D., Harley, M. D., Simmons, J. A. and Turner, I. L. (2019) CoastSat: A Google Earth Engine-enabled Python toolkit to extract shorelines from publicly available satellite imagery. Environmental Modelling & Software, 122, 104528. https://doi.org/10.1016/j.envsoft.2019.104528
- Veefkind, J. P., Aben, I., McMullan, K. et al. (2012) TROPOMI on the ESA Sentinel-5 Precursor: A GMES mission for global observations of the atmospheric composition for climate, air quality and ozone layer applications. Remote Sensing of Environment, 120, 70-83. https://doi.org/10.1016/j.rse.2011.09.027
- Lauvaux, T., Giron, C., Mazzolini, M. et al. (2022) Global assessment of oil and gas methane ultra-emitters. Science, 375(6580), 557-561. https://doi.org/10.1126/science.abj4351