Earth observation guideApplications
Mining and commodities
Mines reshape whole valleys, and the crops and fuels traded on world markets grow and flow in plain view. Satellites measure both.
The basics
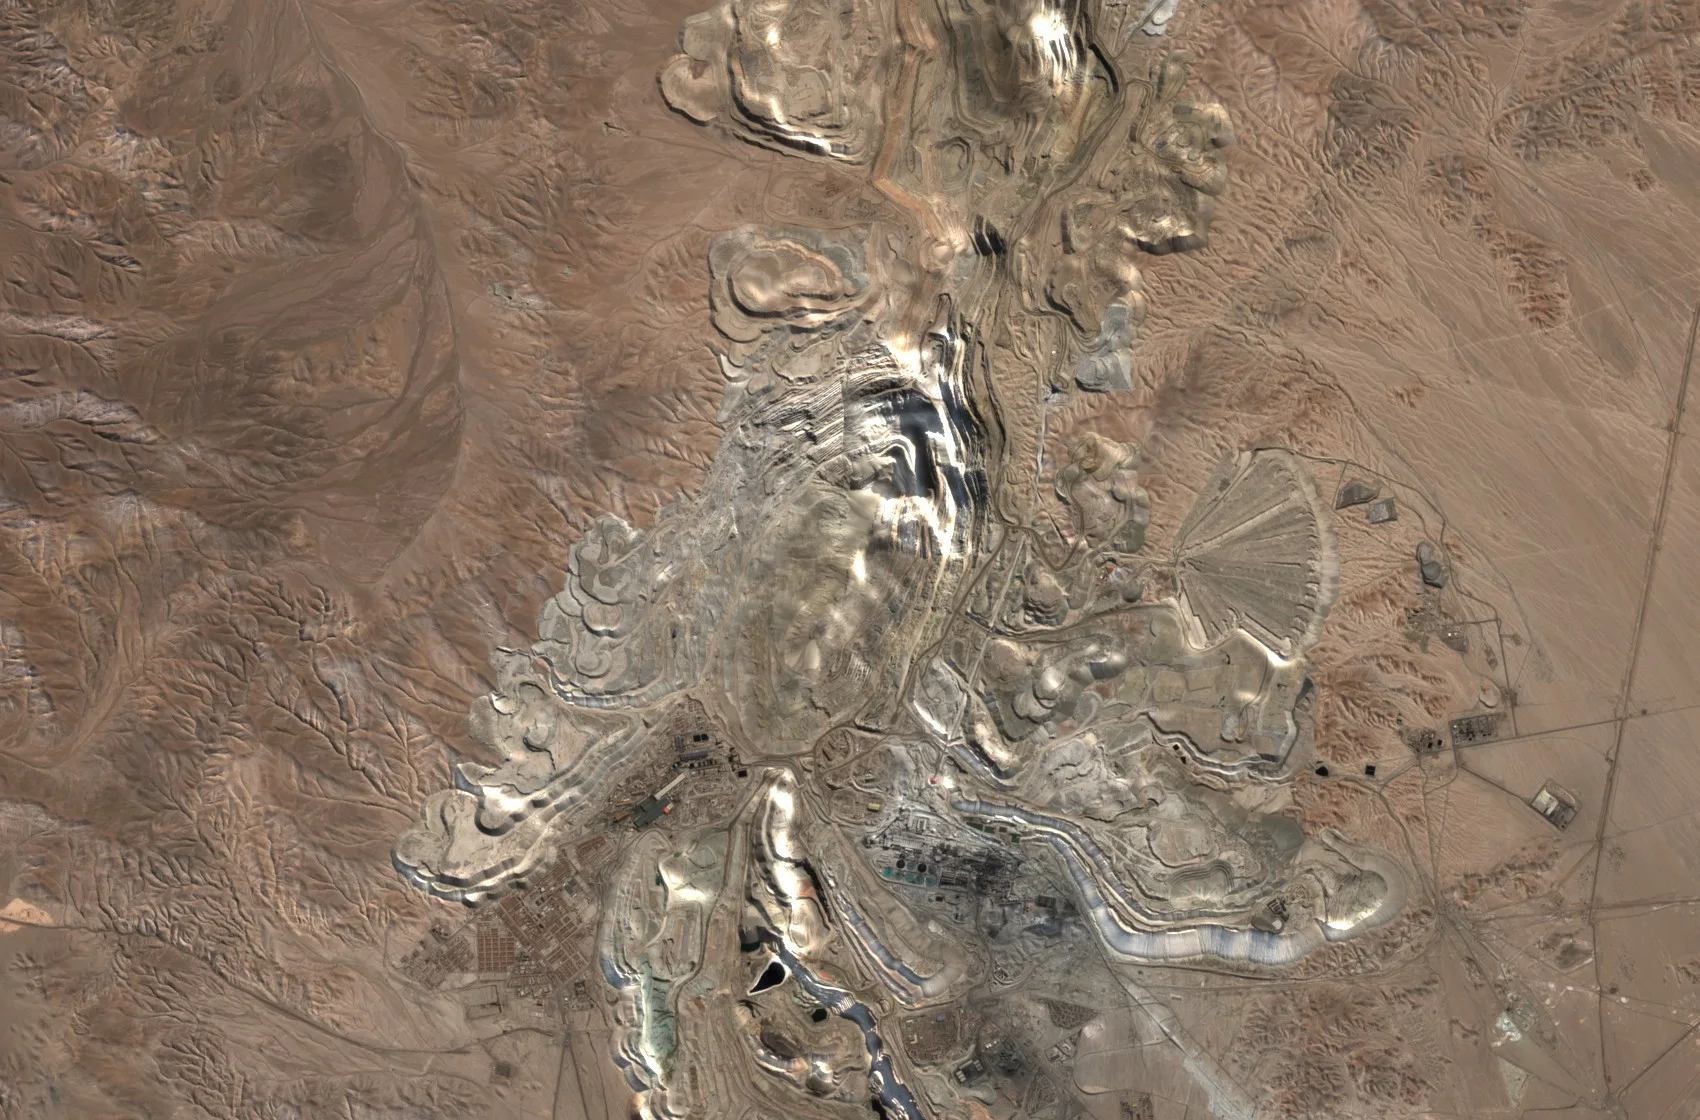
A large mine is a moving landscape. Pits deepen, heaps of waste rock grow, and dams hold back lakes of fine waste called tailings. Satellites follow all of it. They show how far a mine has spread, warn when the ground or a dam wall starts to move in a worrying way, and help geologists spot rocks worth exploring. Traders use the same view more widely, watching crops grow and energy sites operate around the world to judge how much of a commodity will reach the market.
Why it matters
Mines operate in remote places where problems can grow unseen, and failures can be catastrophic. Commodity prices move on news of supply. An independent view from orbit serves both safety and markets.
In depth
Mining companies, their regulators and investors use Earth observation across the life of a mine, from exploration to closure, and commodity analysts use it to estimate supply. The data range from hyperspectral images that identify minerals to radar interferometry that measures the stability of slopes and dams.
Mine footprints
How much land mining uses is a key indicator of its environmental impact, and production statistics do not report it. Visual interpretation of satellite images around more than six thousand active mining sites produced a global dataset of 21,060 polygons covering 57,277 square kilometres, including open cuts, tailings dams, waste rock dumps, water ponds and processing plants [1]. A later dataset of 74,548 polygons, drawn closely around each feature, covers about 66,000 square kilometres [2].
- What is measured
- The outline of pits, dumps, tailings dams, ponds and plant, and how they grow over time.
- Data
- Multispectral images at 10 m, and very high resolution optical imagery for careful outlines. Stereo elevation gives the volume of pits and stockpiles.
- How often
- Annually for inventories, monthly or quarterly for a site.
- Limits
- Interpretation needs judgement about where a mine ends, so datasets drawn to different definitions give different totals, as the two above do.
- Who uses it
- Regulators, researchers, investors assessing environmental impact, and the mining companies themselves.
Tailings dams and slopes
Tailings dams hold back large volumes of waste, and their failure can be catastrophic. The dam at an iron ore mine in Brumadinho, Brazil, collapsed on 25 January 2019 and released 11.7 million cubic metres of tailings, apparently without warning, despite geotechnical monitoring. A later analysis of satellite radar data with the Intermittent Small Baseline Subset technique found that parts of the dam wall and tailings had been deforming in a way not consistent with normal settlement before the collapse, and concluded that its timing could have been foreseen from this precursory movement [3]. The same measurement watches the walls of open pits.
- What is measured
- Millimetre to centimetre movement of dam walls, tailings surfaces and pit slopes over time.
- Data
- Stacks of radar images processed by interferometry.
- How often
- With every new radar image, which is every few days with current missions.
- Limits
- Wet tailings and vegetated slopes lose coherence, movement is seen only along the line of sight, and a satellite record supports but does not replace instruments on the dam.
- Who uses it
- Mine geotechnical teams, dam safety regulators, insurers and investors.
Mineral mapping
Many minerals have characteristic absorption features in the visible, shortwave and thermal infrared, which is how geologists map altered rocks that may point to ore. A review of multispectral and hyperspectral geological remote sensing describes the sensors and methods used to map minerals and rocks from the air and from orbit [4]. The hyperspectral page explains how a spectrum is unmixed into its minerals.
- What is measured
- Reflectance and emission spectra, matched to the spectra of known minerals.
- Data
- Hyperspectral imagery, and multispectral or thermal bands for broad mapping.
- How often
- Once per survey area, since rocks change slowly.
- Limits
- Works best on bare, dry ground. Vegetation, soil and weathered surfaces mask the rock, and a map of minerals at the surface does not prove ore below.
- Who uses it
- Exploration geologists and geological surveys.
Commodity supply
For traded crops, satellite yield forecasts give an early view of supply, as in the regression models that have forecast winter wheat yields in Kansas and Ukraine from a satellite vegetation index [5]. The agriculture page covers crop forecasting, and the energy page covers oil and gas sites, solar parks and wind farms.
- What is measured
- Indicators of production, such as crop condition over growing regions or activity at extraction and processing sites.
- Data
- Multispectral time series for crops, radar and optical imagery for sites.
- How often
- Through each season, or weekly for sites of interest.
- Limits
- An indicator is not a production figure, and models need calibrating against reported output.
- Who uses it
- Commodity traders, analysts and procurement teams.
References
- Maus, V., Giljum, S., Gutschlhofer, J. et al. (2020) A global-scale data set of mining areas. Scientific Data, 7(1), 289. https://doi.org/10.1038/s41597-020-00624-w
- Tang, L. and Werner, T. T. (2023) Global mining footprint mapped from high-resolution satellite imagery. Communications Earth & Environment, 4(1), 134. https://doi.org/10.1038/s43247-023-00805-6
- Grebby, S., Sowter, A., Gluyas, J. et al. (2021) Advanced analysis of satellite data reveals ground deformation precursors to the Brumadinho Tailings Dam collapse. Communications Earth & Environment, 2(1), 2. https://doi.org/10.1038/s43247-020-00079-2
- van der Meer, F. D., van der Werff, H. M. A., van Ruitenbeek, F. J. A. et al. (2012) Multi- and hyperspectral geologic remote sensing: A review. International Journal of Applied Earth Observation and Geoinformation, 14(1), 112-128. https://doi.org/10.1016/j.jag.2011.08.002
- Becker-Reshef, I., Vermote, E., Lindeman, M. and Justice, C. (2010) A generalized regression-based model for forecasting winter wheat yields in Kansas and Ukraine using MODIS data. Remote Sensing of Environment, 114(6), 1312-1323. https://doi.org/10.1016/j.rse.2010.01.010