Earth observation guideApplications
Maritime
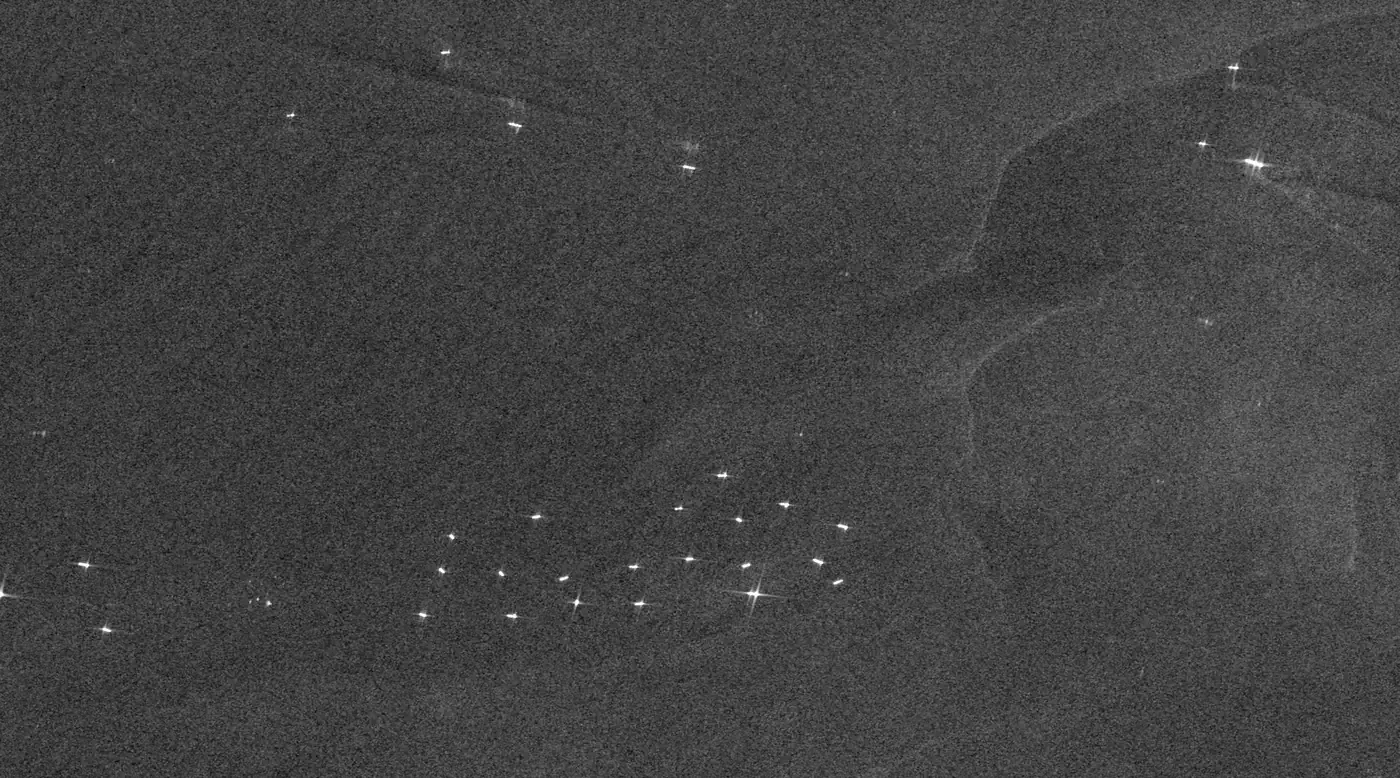
The sea is vast and mostly unwatched. Radar finds ships by day and night through any weather, including the ones that do not report where they are.
The basics
Most large ships broadcast their position by radio, but not all of them do, and some switch it off. A radar satellite does not need the ship's help. A metal hull reflects the radar signal strongly, so on the dark background of the sea each ship shows up as a bright dot, by day or night and through cloud. Comparing those dots with the ships that are broadcasting shows which ones are not. The same images show oil slicks, which calm the sea surface and appear as dark streaks, and night-time pictures show the bright lights that some fishing fleets use to attract their catch.
Why it matters
Most of the world's trade travels by sea, and much fishing and pollution happens far from any observer. Satellite images are often the only independent evidence of what happened at sea.
In depth
A literature survey of vessel detection notes that radar is still the leading technology for maritime monitoring, while studies based on optical satellite images are growing quickly [1]. Radar finds the ship, and optical imagery, where cloud allows, shows what kind of ship it is. Offshore wind farms and platforms are covered on the energy page.
Ship detection
Calm sea returns little of the radar pulse, while a ship's hull and superstructure form corners that return a great deal. A detector therefore compares each pixel with the sea around it and flags those that stand out by more than a threshold, a design known as constant false alarm rate detection because the threshold is set by the statistics of the local background. Combining radar detections with the Automatic Identification System, which ships broadcast, shows how the two complement each other. Terrestrial AIS typically reaches about 40 km from the coast, satellite AIS extends that almost worldwide, but not all ships operate AIS and smaller ones are not fitted with it [2].
- What is measured
- Bright targets against the sea background, with their position, length and heading.
- Data
- Radar at 3 to 20 m, finer for small boats, and optical imagery to identify vessel types.
- How often
- Each pass, which for a given stretch of sea is every few days with open missions and more often with commercial constellations.
- Limits
- Rough seas raise the background and hide small boats, and wind turbines, platforms and image artefacts can be mistaken for ships.
- Who uses it
- Coastguards, fisheries inspectors, port authorities, shipping analysts and insurers.
Vessels that do not broadcast
A global study combined satellite imagery, vessel GPS data and deep learning to map industrial vessels in the world's coastal waters from 2017 to 2021. It found that 72 to 76 per cent of the world's industrial fishing vessels are not publicly tracked, and that 21 to 30 per cent of transport and energy vessel activity is missing from public tracking systems. It also measured a fall of 12 per cent in fishing at the onset of the COVID-19 pandemic in 2020 [3].
- What is measured
- Radar or optical detections with no matching broadcast position at the time of the image.
- Data
- Radar and optical imagery matched against AIS records.
- How often
- Each image, building into a picture of activity over months.
- Limits
- An image is a snapshot, so a ship that is dark at one moment may be broadcasting minutes later. Matching depends on accurate timing and positions.
- Who uses it
- Fisheries agencies, navies and coastguards, sanctions and compliance teams, and conservation groups.
Oil spills
Oil on the sea damps the small waves that scatter radar back to the satellite, so a slick appears as a dark patch on a brighter sea. A review of satellite oil spill detection covers how slicks are detected in radar images and how they are told apart from look-alikes, such as calm water in low wind, that are equally dark [4].
- What is measured
- Dark, damped areas in radar backscatter, their shape and their contrast with the sea around them.
- Data
- Radar with a wide swath, and optical or aerial checks to confirm.
- How often
- Each pass over shipping lanes and oil fields.
- Limits
- Low wind makes the whole sea dark, strong wind breaks slicks up, and natural films look like oil. Radar shows a slick, not how thick it is.
- Who uses it
- Maritime safety agencies, environmental regulators and oil and gas operators.
Fishing at night
Some fleets fish at night under bright lights, and satellites have been able to detect lit fishing boats since the 1970s. An automatic algorithm now finds them in the low-light band of a night-time imager as sharp spikes, rates their brightness and removes detections on land and from gas flares [5]. The night lights page explains the measurement.
- What is measured
- Point sources of light at sea, their location and brightness.
- Data
- Night lights at around 750 m.
- How often
- Nightly.
- Limits
- Only boats that use lights are seen, and cloud blocks the view.
- Who uses it
- Fisheries managers and researchers.
References
- Kanjir, U., Greidanus, H. and Oštir, K. (2018) Vessel detection and classification from spaceborne optical images: A literature survey. Remote Sensing of Environment, 207, 1-26. https://doi.org/10.1016/j.rse.2017.12.033
- Brusch, S., Lehner, S., Fritz, T. et al. (2011) Ship Surveillance With TerraSAR-X. IEEE Transactions on Geoscience and Remote Sensing, 49(3), 1092-1103. https://doi.org/10.1109/TGRS.2010.2071879
- Paolo, F. S., Kroodsma, D., Raynor, J. et al. (2024) Satellite mapping reveals extensive industrial activity at sea. Nature, 625(7993), 85-91. https://doi.org/10.1038/s41586-023-06825-8
- Brekke, C. and Solberg, A. H. S. (2005) Oil spill detection by satellite remote sensing. Remote Sensing of Environment, 95(1), 1-13. https://doi.org/10.1016/j.rse.2004.11.015
- Elvidge, C., Zhizhin, M., Baugh, K. and Hsu, F.-C. (2015) Automatic Boat Identification System for VIIRS Low Light Imaging Data. Remote Sensing, 7(3), 3020-3036. https://doi.org/10.3390/rs70303020