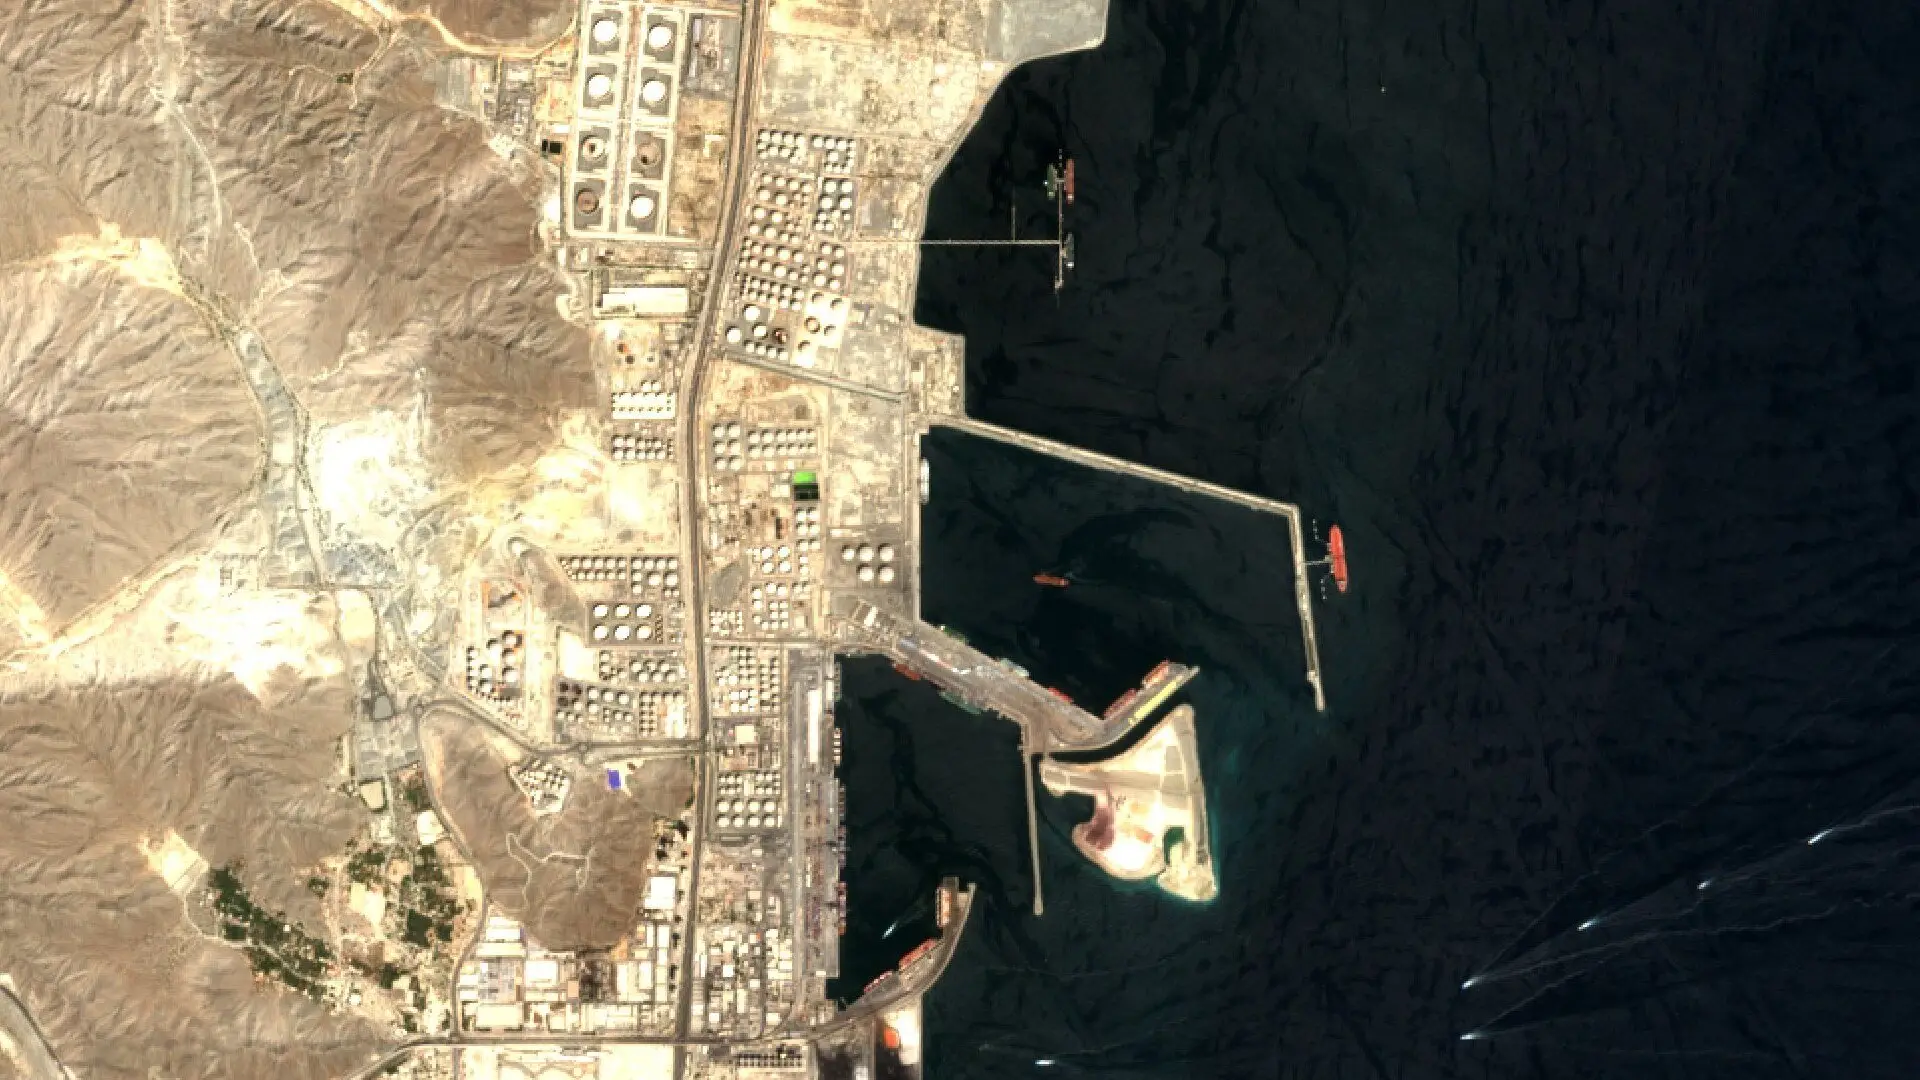
Energy assets are large, fixed and easy to see from above. For commodity traders, project financiers and insurers, satellite imagery offers a way to check what is happening at an oil terminal or a solar park without relying on a single reported figure. The scene above shows the oil terminals at Fujairah on the Gulf of Oman.
Storage at oil terminals
Many large oil tanks have floating roofs that rise and fall with the liquid inside. As a tank empties, the roof sinks and the rim casts a shadow across it, so the shape of that shadow says something about how full the tank is [1]. The method needs very-high-resolution imagery, because each tank must be many pixels wide for the shadow to be measured [1]. At 30 cm, imagery makes this possible across a whole terminal, and repeat passes build a picture of storage over time. The free Sentinel-2 image above, at 10 m [2], shows where the tanks and berths are and how many ships are at anchor, but not the fill level of any tank.
Solar parks and project finance
Utility-scale solar parks such as Bhadla in Rajasthan, India, cover many square kilometres of desert [3]. During construction, imagery shows which blocks have panels, which have only foundations and which are still bare ground. A lender can compare that with the drawdown schedule. After completion, an insurer or a buyer of the asset can confirm that what was financed exists, where it should be and at the size stated.
Heat from industrial sites
High-resolution thermal imagery from satellites records the heat given off by the ground and by structures [4]. Over refineries, power stations and heavy industry, it can show which parts of a site are warm, which is one indication of whether they are in use [4]. Thermal imagery supports a view of activity and does not measure output on its own.
Finding the imagery
Data Sphere lets a team search optical imagery from several suppliers through one API and one STAC format, with licence terms enforced by the platform. The imagery for this work can be searched across suppliers on Data Sphere. To see it for a site you follow, write to info@astrodynamic.space.
References
- Wang, T., Li, Y., Yu, S. and Liu, Y. Estimating the Volume of Oil Tanks Based on High-Resolution Remote Sensing Images. Remote Sensing, 11(7), 793, 2019. https://doi.org/10.3390/rs11070793
- European Space Agency. S2 Mission. SentiWiki, Copernicus Sentinel Online. https://sentiwiki.copernicus.eu/web/s2-mission
- Press Information Bureau, Government of India. India’s Solar Growth Enters a New Era (backgrounder on the Solar Parks Scheme and Bhadla Solar Park). Ministry of Information and Broadcasting, 2 August 2026. https://www.pib.gov.in/PressNoteDetails.aspx?NoteId=159396&ModuleId=3®=46&lang=1
- European Space Agency. HotSat-1. ESA Earth Online. https://earth.esa.int/eogateway/missions/hotsat-1